Value-Based Food Consumption: More Respect for Elders & Care for the Young; Indians still prefer to visit markets for buying daily vegetables...
FinTech BizNews Service
Mumbai, 01 November, 2026: The State Bank of India’s Economic Research Department has come out with a Research Report titled “India’s Consumption Journey”. The report has been authored by Dr. Soumya Kanti Ghosh, Group Chief Economic Advisor, State Bank of India.
India’s Consumption Journey: Value based system of food consumption with more respect for Elders, care for Youngers and a conscious move towards a more balanced dietary pattern of Indian household's agnostic to income categories.. Indians still prefer to visit markets for buying daily vegetables…
Household consumption pattern indicate a gradual shift in expenditure from food essentials (33%) towards non-food items and services (67% together)
• An important spatial dimension of food-security support is that rural households accounting for a larger share of reported beneficiaries in most states
❑ Consumption of protein-rich items shows a considerable interstate variations, indicating disparities in dietary consumption patterns across India
• Consumption of protein rich item reveal considerable gender-based variation in the prevalence of higher diversity across the selected proteinrich food categories – For example, male record higher percentages than female in most states, with particularly large gaps in Telangana, Odisha, Punjab and Chhattisgarh
❑ At the item level, households differ substantially in the allocation of their food budgets across several food categories, although the extent of heterogeneity varies considerably across items even with the same level of income. The largest differences are observed in cereals and pulses, and to some extent milk products. Remarkably, egg/fish/meat, vegetables, dry fruits, fresh fruits and to some extent served food exhibit considerably lower dispersion in expenditure shares.
• This indicates that Indian households are now more conscious of their dietary patterns towards more protein diets, vegetables, fruits that is agnostic to their income levels.. This is a welcome development for a country that is still young
• Simultaneously, Indian households also enjoy packaged processed food with expenditure shares allocated to these categories become substantially more similar across households in higher expenditure groups
❑ A large part of Indian households still prefer ......
A large part of Indian households still prefer a value-based system of respect for elders in the family and care for youngers in the family consistent with the traditional beliefs and is contrary to western culture. We observe from the data that a family with more elderly people allocate food relatively more toward milk, fruits and vegetables while families with young kids try to balance the interest of the younger members by allocating toward milk and milk products as well as served and packaged food
❑ The increasing adoption of digital platforms for purchasing goods and services indicates a gradual transformation in household consumption behavior, with digitalization facilitating greater access to a wider range of products and services primarily concentrated in consumables & services (39.68%), followed by durable goods (23.3%), while purchases of food items remain comparatively limited (7.10%)
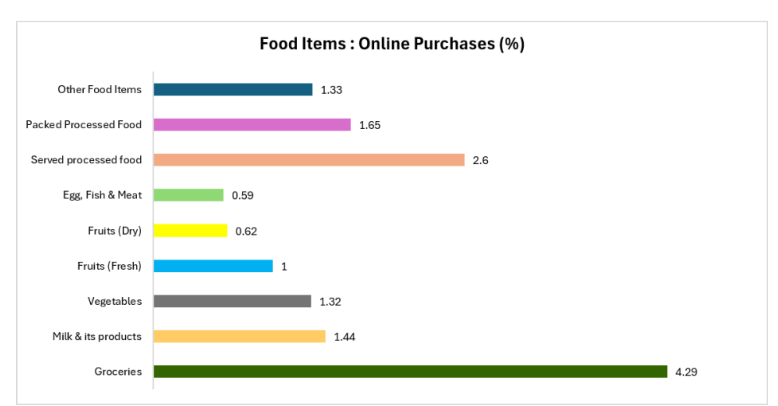
• For food items, online purchases remained limited for Vegetables (1.32%), Fresh fruits (1.0%), Dry fruits (0.62%) and Egg, fish & meat (0.59%), reflecting continued reliance on traditional retail channels for perishable items and the fact that people still prefer to visit markets for such food products
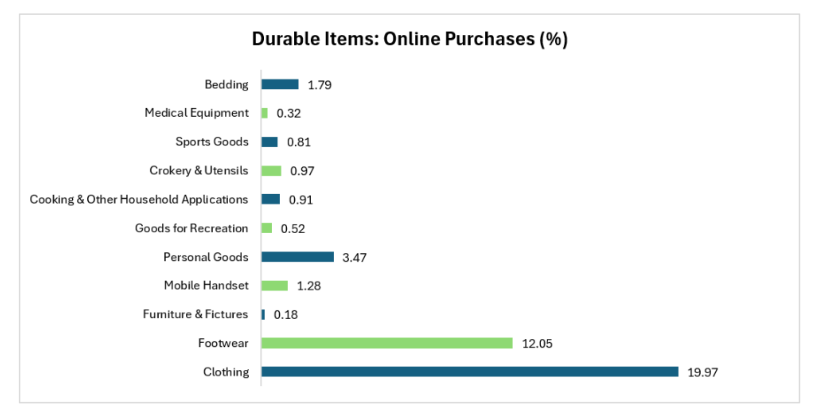
• For service items The online adoption is relatively higher for Clothing (19.97%) and Footwear (12.05%), indicating strong preference for digital platforms for personal-use durable items
• Digital purchases also remain limited for high-value durable categories, including Furniture (0.18%), Medical equipment (0.32%), and Recreational goods (0.52%), suggesting continued preference for offline channels
Survey profile for the analysis…
Unit level data merging…
❑ The analytical dataset was constructed by merging information across the 15 survey levels at the household level using a unique household identifier.
❑ The common identifier (CCID) was generated by combining the First Stage Unit (FSU) Serial Number, Second Stage Stratum Number, and Sample Household Number, ensuring accurate linkage of household information across all survey schedules.
❑ The final merged dataset comprises 261,953 households for empirical analysis.
India’s consumption Pattern: State-wise Trends
Composition of household consumption expenditure in India
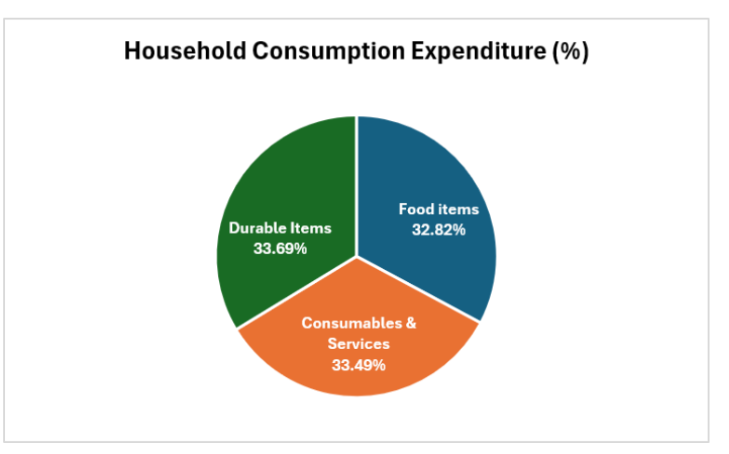
❑ Food expenditure accounts of 32.82% of total household consumption expenditure reflecting the continued importance of the basic consumption needs
❑ Non-food items and services together account 67% of household spending, indicating a shift towards diversified consumption
Protein rich consumption of food items varies across states…
❑ There exist considerable interstate variations in household expenditure on protein-rich food items, indicating disparities in dietary consumption patterns across India
❑ Sikkim and Goa record the highest average expenditure on selected protein-rich foods, followed by Haryana, while Odisha, Chhattisgarh and West Bengal report the lowest levels
❑ These differences may reflect variations in household purchasing power, food prices and dietary preferences, highlighting the uneven expenditure patterns on protein-rich food items across states.
Gender gaps in consumption of protein rich categories…surprisingly males outstrip females significantly in states like Telengana, Odisha, Punjab and Chhattisgarh in terms of consumption of protein rich items
❑ Consumption of protein rich item reveal considerable genderbased variation in the prevalence of higher diversity across the selected protein-rich food categories
❑ Among the states considered, male-coded observations record higher percentages than female-coded observations in most states, with particularly large gaps in Telangana, Odisha, Punjab and Chhattisgarh
❑ Rajasthan records the lowest percentages for both groups, at 60.49% for males and 49.06% for females which could also reflect the preference pattern for overall percentage but reflects gender based variation which is substantial
❑ In contrast, the gender gap is relatively narrow in Assam, Uttar Pradesh and Gujarat
❑ The difference reflect household food preferences, affordability and access to diverse food items
Penetration of LPG as a primary cooking fuel…
❑ LPG usage varies considerably across states, with Goa and Punjab recording high adoption, followed by Andhra Pradesh, Karnataka and Tamil Nadu. In contrast, usage remains relatively low in Odisha, Chhattisgarh, Jharkhand, Rajasthan and Bihar
❑ The rural–urban gap is particularly pronounced in Jharkhand (17.2% rural versus 77.6% urban), Chhattisgarh (15.3% versus 81.3%), Odisha (16.8% versus 63.5%) and Rajasthan (22.9% versus 85.6%)
❑ Assam and West Bengal also exhibit considerable gaps, with rural LPG use at 36.3% and 20.5%, respectively, compared with 94.3% and 82.9% in urban areas
❑ These disparities suggest that access to clean cooking fuel remains uneven, particularly in rural eastern and central India
PMGKAY beneficiary state wise
❑ PMGKAY beneficiary coverage also exhibits substantial rural– urban variation, with rural coverage generally exceeding urban coverage across most states. The differences are particularly striking in Gujarat (61.3% rural versus 19.7% urban), Maharashtra (63.3% versus 18.9%), Rajasthan (66.5% versus 26.4%) and Karnataka (71.1% versus 34.0%).
❑ Rural coverage is especially high in Andhra Pradesh (90.5%), Telangana (89.3%) and Chhattisgarh (87.1%), while coverage is comparatively low in states such as Himachal Pradesh and Punjab.
❑ This reveals an important spatial dimension of food-security support, with rural households accounting for a larger share of reported beneficiaries in most states
Heterogeneity in household consumption basket
Household consumption heterogeneous at item as well as expenditure level even at the same level of income …
❑ We begin by examining whether household food baskets are homogeneous or whether households differ substantially in the way they allocate their food budgets. At the item level, households differ substantially in the allocation of their food budgets across several food categories, although the extent of heterogeneity varies considerably across items even with the same level of income. The largest differences are observed in cereals and pulses, and to some extent milk products. Remarkably, Egg/fish/meat, vegetables, dry fruits, fresh fruits and to some extent served food exhibit considerably lower dispersion in expenditure shares.
❑ However, such heterogeneity could simply reflect differences in the overall amount households spend on food. To establish whether households with broadly similar resources / income also exhibit different consumption patterns, we therefore group households into 20 foodexpenditure groups and measure Basket heterogeneity which is the Euclidean distance between the household's basket and the typical basket of households with similar food expenditure
The results reveal substantial within-group heterogeneity. Even among households with similar food expenditure, the average distance from the group-specific basket remains sizeable.
Household Consumption shows a U-shaped pattern in food expenditure
❑ To examine whether household food baskets become more homogeneous as food expenditure rises, we estimate the relationship between basket heterogeneity and food expenditure using the Euclidean distance of each household's consumption basket from the expenditure-group mean basket
❑ We allow for a non-linear relationship by including both the log of food expenditure and its square. The results show a clear U-shaped pattern: the coefficient on log food expenditure is negative and statistically significant (−0.672), while the squared term is positive and significant (0.040), indicating that basket heterogeneity initially declines with food expenditure but rises again at higher expenditure levels
Sources of heterogeneity among household baskets…
❑ We then examine the sources of this U-shaped pattern by decomposing withinexpenditure-group heterogeneity across food categories. The decline in heterogeneity from the lowest to the middle expenditure groups is broad-based but is particularly pronounced for served processed food, packaged processed food, beverages, vegetables and fresh fruits
❑ Thus, the magnitude of decline of standard deviation across expenditure quantiles reflects concentration. If standard deviation declines more for a particular food category, it reflects that there is convergence or concentration in the consumption of that category as we move from lower to higher quantiles
❑ The standard deviation falls sharply for served processed food (Highest decline -0.224) and -0.09 for packaged processed food, indicating that expenditure shares allocated to these categories become substantially more similar across households in higher expenditure groups reflecting that higher expenditure group consumers are more concentrated towards these categories
❑ Similarly, the sharper decline in dispersion for vegetables relative to cereals, suggests greater convergence in expenditure allocation towards these items as food expenditure rises
Demographics explain the source of heterogeneity…
❑ We examined whether household demographic and livelihood characteristics explain differences in food-basket composition conditional on food expenditure
❑ The results show that household structure irrespective of rural and urban significantly shapes food allocation: households with a higher elderly share allocate relatively more toward milk, fruits and vegetables and less toward served and packaged food, while those with a higher child share allocate more toward milk and milk products as well as served and packaged food and less toward pulses, vegetables and fruits
❑ Livelihood also matters, with regular-wage households allocating 2.5 percentage points more toward served food, while casual-labour households allocate relatively more toward cereals and egg/fish/meat but less toward milk and fruits
❑ Larger households similarly show greater allocation toward staples such as cereals and pulses
❑ Food-basket composition reflects not only the size of the food budget but also the demographic and livelihood structure of the household
States diverge in consumption pattern
❑ The state-level analysis further highlights the pronounced geographical heterogeneity in food-basket composition
❑ The differences are particularly striking across individual food categories. For instance, milk and milk products account for as much as 28.6% of food expenditure in Haryana, while cereals constitute 38.6% in Jharkhand
❑ Chhattisgarh records a particularly high allocation toward pulses (20.5%) and vegetables (14.3%), whereas egg, fish and meat account for 21.6% in Nagaland and 18.6% in Mizoram
❑ Differences are also evident in newer components of the food basket: served/ready-to-eat food accounts for 16.3% in Telangana, while packaged processed food reaches 11.4% in Goa
Digitalization and change in household consumption basket
Household Adoption of Online Purchase/Payment: An Overview
❑ 45.6% of Indian household reported using online purchase/payment for at least one consumption item, indicating the growing penetration of digital transactions in household consumption
❑ Nearly half of the Indian households (54.4%) reported not using online purchase/payment
❑ Digital purchases are primarily concentrated in consumables & services (39.68%), followed by durable goods (23.3%), while purchases of food items remain comparatively limited (7.10%)
Digital adoption in Food Items
❑ Grocery purchases recorded the highest digital adoption (4.29%), indicating greater acceptance of online platforms for routine food items
❑ Adoption was relatively higher for Served processed food (2.62%) and Packed processed food (1.65%) compared to fresh food categories
❑ Online purchases remained limited for Vegetables (1.32%), Fresh fruits (1.0%), Dry fruits (0.62%) and Egg, fish & meat (0.59%), reflecting continued reliance on traditional retail channels for perishable items
Digital adoption in Consumables & Services
❑ Services account for the largest share of online purchases (37.93%), followed by Fuel & Light at 15.96%
❑ Medicine & Other medical services (1.69%) and Education (1.83%) have the lowest shares of online purchases
Digital adoption in Durable Items
❑ The online adoption is relatively higher for Clothing (19.97%) and Footwear (12.05%), indicating strong preference for digital platforms for personal-use durable items
❑ Other categories such as Personal goods (3.47%) and Bedding (1.79%) show moderate online adoption
❑ Digital purchases remain limited for high-value durable categories, including Furniture (0.18%), Medical equipment (0.32%), and Recreational goods (0.52%), suggesting continued preference for offline channels
Online purchase/payment by MPCE (Monthly Per Capita Expenditure) quintile
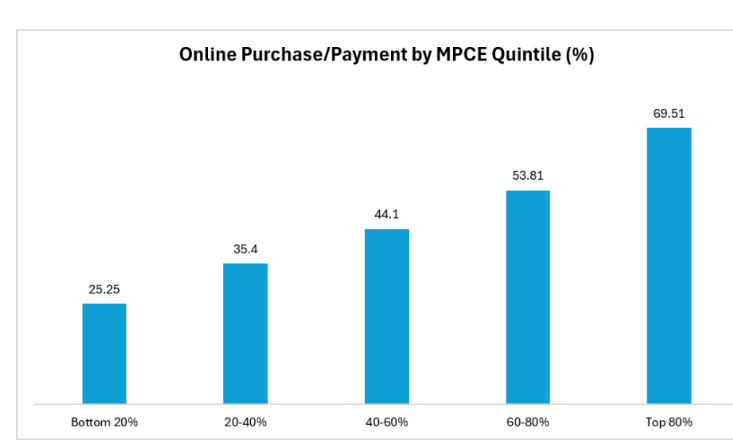
❑ The share of the household using online purchase/payment increases consistently across MPCE quintiles, from 25.3% in the bottom quintile to 69.5% in the top quintile
❑ The 44.3 percentage-point gap between the bottom and top quintiles highlights a substantial consumption gradient in online adoption
State-wise variation in average MPCE
Average monthly per capita consumption expenditure varies significantly across states, with Haryana recording the highest MPCE, followed by Kerala, Goa, and Telangana, while Bihar and Uttar Pradesh report comparatively lower consumption levels.
Leading States across consumption categories…
❑ The table presents the top five states with the highest average monthly consumption expenditure across food, consumables & services, and durable items categories.
❑ Haryana ranks first across all three consumption categories, indicating the highest average household consumption expenditure among the states.
❑ Goa, Nagaland, and Kerala consistently appear among the leading states, reflecting higher consumption levels across both essential and non-essential consumption categories.
❑ The ranking highlights substantial regional variation in household consumption patterns, with some states exhibiting higher expenditure across multiple consumption segments.
Digital adoption and household consumption expenditure
Fixed effect log-linear model shows that online purchase/payment adoption is positively associated with household consumption expenditure after controlling for the household characteristics and state-districts fixed effects
❑ Digitally adopting household exhibit 7.5% higher Monthly Per capita Consumption Expenditure (MPCE), indicating higher consumption levels among online users
❑ Food expenditure is 21.4% higher, reflecting increased use of digital platforms for food-related consumption
❑ The difference is more pronounced for services (23.4%) and durable goods (24.5%), suggesting greater digital engagement in non-food consumption categories
❑ The results highlight that digital adoption is linked with higher consumption intensity and a shift towards diversified consumption patterns
