Rate hike cycle has become shorter while rate cut cycle is getting stretched. NIIF's analysis of RBI's policy over the last 20-years indicates that a pause in a rate cycle lasts between 3 and 14 months
FinTech BizNews Service
Mumbai, January 23, 2024: As we gear up to celebrate The Republic Day, a symbol of India’s progress and growth, National Investment and Infrastructure Fund Limited is excited to launch its report on -“How we Track India’s Macro Story”.
The report captures the essence of the many economic analyses done by NIIF’s research team through the year to provide a nuanced understanding of India’s evolving macroeconomic landscape using the GRIX framework.
NIIF’s journey to distill meaningful insights from a sea of statistics led to the development of the Growth, Rates, Inflation, Exchange rate (GRIX, pronounced Greeks) framework.
According to Akhilesh Tilotia, Head of Research & Chief of Staff, National Investment & Infrastructure Fund Limited, “At NIIF, we track hundreds of variables in our monthly reports which help us identify key turning points in the Indian, and sometimes global, economy. The most interesting part is to analyse all these diverse turning points to make sense of the broader economic picture that emerges. We’ve developed the Growth, Rates, Inflation, Exchange rate (GRIX, pronounced Greeks) framework to sharpen our focus on what is critical from an investment perspective. With investors, we share our insights quarterly on key trends in India’s economy. Digital India has created an exhaust of data generated and collected at various public forums. One such analysis is our tolls HeatMaps based on copious amounts of data. In these analyses, which combine sectoral knowledge with expertise in data sciences and visualisation, we have created a valuable partnership with Thurro/Adqvest.”
Growth is the elixir that uplifts citizens and attracts investors
India is expected to be the third largest economy by FY2028, closing in on a GDP of USD 5 trillion. India remains a global outlier in business optimism. Key agencies revise their FY2024 forecasts upwards to 6.3% (median) from 6.0%
Demand for core infra inputs (cement, steel, etc.) and energy remains strong. India’s digital public infrastructure enabling all time high UPI payments and electronic toll collection in 2023 2 We have three new ways to track growth: (i) growth in industries across states, (ii) economic activity across income levels, and (iii) movement across toll roads 3 India’s labor force is estimated to have increased over the last five years, as per a government survey, likely driving demand for goods, services, and infra. However, another employment (private) survey shows labor force stagnating.
India expected to be the third largest economy by FY2028
India’s growth story remains strong - expected to be the third largest economy by FY2028. India took eight years to move from the tenth largest economy to sixth; onwards to third in next eight Ranking of economies according to GDP, current prices (%), CY2001 to CY2027E.
This shows up in India being a significant global outlier in business optimism. India’s composite Purchasing Managers' Index (PMI) stands out among other major economies. The composite PMI index is a key measure of activity and optimism at companies across manufacturing and services. Median GDP growth projection for FY2024 revised upwards to 6.3%; RBI raises its forecast to 7.0%; government has recently upped it to 7.3% Projections for real GDP growth in FY2024 (% yoy), Jan '23 to Dec '23.
Robust domestic demand: we track movement of people, goods, and money
Monthly e-way bills average ~90 million through the year, with positive growth every month Monthly number of e-way bills, FY2020-FY2024 (Dec '23).
FasTag collection stabilised around ~INR 53 billion in CY2023, sharp uptick in December UPI transaction value crosses USD 2 trillion in CY2023 Unified Payment Interface (UPI), monthly volumes and value, FY2017-FY2024 (Dec '23) Monthly national electronic road toll collection, FY2017-FY2024 (Dec '23). UPI transaction value crosses USD 2 trillion in CY2023 Unified Payment Interface (UPI), monthly volumes and value, FY2017-FY2024 (Dec '23.
Strong growth in core commodities that underpin the economy. After a brief flutter, electricity demand grew strongly through the year In the last 10 years, steel production has doubled, CY2023 saw sharp growth in output Monthly electricity demand in India, FY2014-FY2024 (Dec '23).
In the last 10 years, steel production has doubled, CY2023 saw sharp growth in output Monthly electricity demand in India, FY2014-FY2024 (Dec '23) Monthly crude steel production, FY2014-FY2024 (Nov '23). Cement production growth has largely been strong over the years since Covid Growth in coal production maintained double-digit yoy growth all throughout the year Monthly coal production, FY2014-FY2024 (Dec '23) Monthly cement production, FY2014-FY2024 (Nov '23). Growth in coal production maintained double-digit yoy growth all throughout the year Monthly coal production, FY2014-FY2024 (Dec '23).
High-frequency metrics across ten largest states are early markers of trends
Gross State Domestic Product (GSDP) of the top 10 states in the matrix account for 72% of India’s GDP in FY2022. A ‘salad bowl’ heatmap of the industries across states gives us insights into what might change for others Change in economic indicators across top 10 states (% yoy), Dec ’23. Volume growth in segments across income levels indicates areas of growth/stress. While such bundles are subjective, they offer a bird’s eye view on the dynamics across income segments. HeatMaps using toll data gives an overview of growth clusters across the country. Total collections in all plazas INR 43.5 bn. Total collections in plazas mapped: INR 37.6 bn. Value per transaction: INR 172.7 Average mapped toll growth 11.3% yoy. 1.663 toll plazas mapped out of 857 published by IHMCL 2.Size of the dot reflects the relative amount of transaction as a proportion to the total The value of toll collections shows the trend of the spend on logistics. Volume numbers are not influenced by increased toll rate. HeatMaps for tolls visualise year-on-year growth in toll traffic (volume) and collection (value) across ~658 NHAI toll plazas in any given month.
We track employment metrics closely as they underpin our long-term forecasts for growth
The difference in labor force estimates of PLFS and CMIE may be partly explained by the difference in methodology. A person is classified in labor force if they are employed or willing to work and actively looking for a job:
1.PLFS: for at least 1 hour on any day during the 7 days preceding the date of survey
2.CMIE: on the date of survey, or previous day in cases when survey is conducted in the morning.
The most well-behaved factor was “R”: Rates
Rates determine the present value of future cashflows. What we tracked in India’s interest rates # Key Insight from our research in 2023 Metric. India launched sovereign green bonds of INR 160 billion in CY2023 opening a new avenue for fund raising and investment; no green premium observed.
1 Foreign portfolio investors remain invested in Indian markets.
2 Net foreign direct investments into India slowed in CY2023
3 Government focuses on capital expenditure. Strong direct tax collection growth in FYTD2024 creates fiscal space
4 Spread between India and US 10-year G-sec yields recorded a 17-year low in October 2023 as US yields rose sharply. Indian yields have been stable
Sovereign green bonds (SGBs) launched – no green premium, unfortunately. No green premium – 10-y SGBs & 5-y SGBs trade at same yield as sovereign.
Foreign investors show faith in Indian markets – both Dalal Street and Main Street. India continues to be an attractive investment destination for foreign portfolio investors (FPIs). However, net foreign direct investments (FDI) fluctuated sharply in 2023.
Strong direct tax collection growth in FYTD2024 creates fiscal space for the government. India-US yield spread at multi-decadal lows driven by better inflation management in India. Inflation is the silent force that influences real returns on investments.
We analyse RBI’s monetary policy over the last 20 years.
Transmission of 250 bps repo rate hike yet to be completely transmitted via the banking system. Low interest rate differentials due to better inflation management in India.
We looked to central banks for guidance – though they have been uncertain themselves. US interest rate projections by the Federal Reserve members continuously revised through the year. The rate hike cycle is likely complete in the US. Central bank rates are expected to remain higher even with a projected 75 bps rate cut (as of Dec 2023) in CY2024.
We are now in a world which is uncertain on the: (1) trajectory of interest rates, i.e., how high the rates will go, and (2) timing of lowering them, or for how long will rates remain high. The uncertain trajectory and timing lead us to the call this period Uncertain T^2 (or, uncertain T-square). We are conscious that this also refers to the place the world is now in: Uncertainty Square!
Rate hike cycle has become shorter while rate cut cycle is getting stretched. Our analysis of RBI’s policy over the last 20-years indicates that a pause in a rate cycle lasts between 3 and 14 months.
Monetary policy lags are “uncertain and variable”. Transmission of hike in repo rates not yet completely transmitted via the banking system.
Late monsoon has a higher chance of being deficient – India was lucky in CY2023. Even though the monsoon was delayed by a week, overall it turned out to be normal. Variability in monsoon (deficient or excess) can likely contribute to inflation, mainly via agriculture. Therefore, we analysed if a delay in the onset of monsoon results in a normal monsoon or not.
Exchange rate fluctuations steer global investment attractiveness
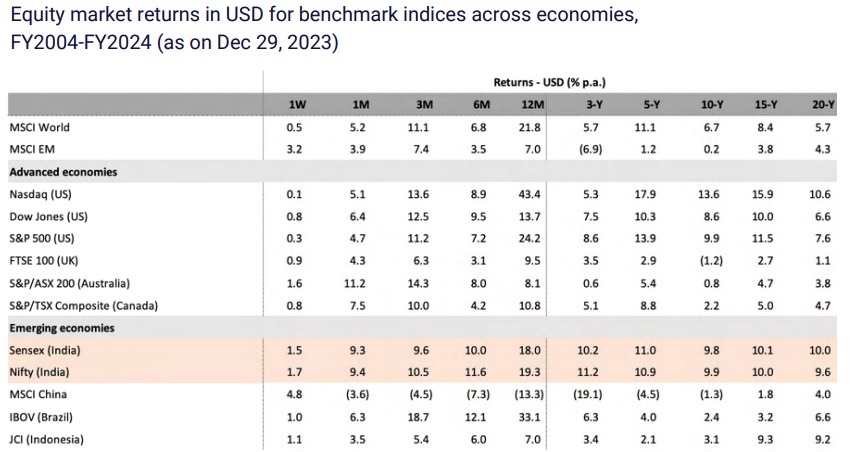
How we track India’s INR story # Key Insight from our research in 2023 Metric Rupee has been a stable currency over the last year. IMF makes a remarkable change in its forecasts estimating a lower depreciation over next five years. Rupee strength also reflected in the 1-year forward premium of USD/INR which is at a multi-year low. India now accounts for greater share of world services trade driven by 12% p.a. USD growth in services exports between Sep 2019 and Sep 2023. India’s goods trade deficit is significantly offset by services trade surplus. Indian equity indices outperform global indices, even in USD, through the years.
IMF forecasts have made a remarkable change in USD-INR estimates
1IMF publishes forecasts for nominal GDP in USD and local currency (INR) for the next five years. Using this, we calculate the implied foreign exchange rate and further calculate the expected depreciation rate over the next five years 2. Data and forecasts are presented on a fiscal year basis (AprMar) with FY2022-23 (starting in April 2022) shown under 2022. Similarly, for other years NIIF RESEARCH USD-INR pair estimated to be in a narrower range over next 5 years. IMF’s forecast indicates lower depreciation of INR vis-à-vis USD over time.
Rupee strength also reflected in the multiyear low USD/INR forward premium.
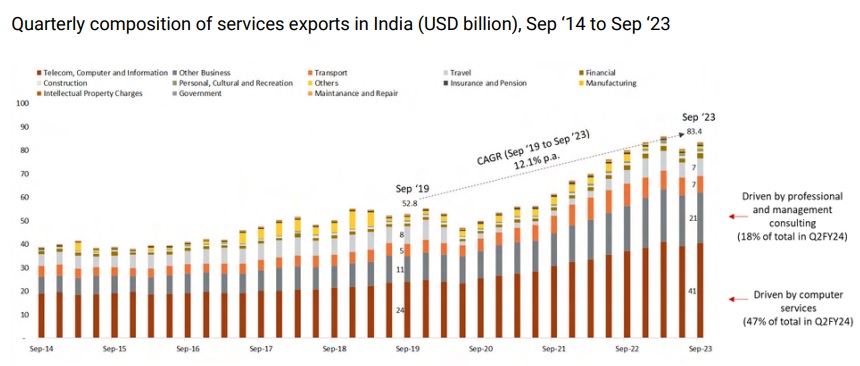
India’s share in global services trade sharply picks up, goods trade flat. Services exports offsetting goods trade deficit.
India is now emerging as the “service capital of the world”
Services exports grew by 12% p.a. USD between Sep 2019 and Sep 2023 largely by IT and consulting services.
Other business includes (share as of Q2FY24) research and development (2.2%), professional and management consulting (17.9%), and technical, trade related (5.6%), etc.
Delivered returns on Indian equity, even in USD, outperformed peers through the years
Indian equity markets generate strong returns across time periods
CY2024: what we will watch out for
Elections and global political changes: 2024 is a year of elections both in India and the US, apart from 60+ other countries. Across the world, elections are expected to either herald a significant change in policies or cement consistency. Macroeconomic policies in India largely have bipartisan support - we expect stability in the growth momentum that India saw in 2023.
Geopolitics: Over the last two years, we have learnt to look for the narrowest of straits and the smallest of warm-water ports that might suddenly turn strategic. Alliances are evolving as events unfold. These changes can create new channels for flows of capital and trade or build walls behind which countries can hide. The idea of creating prosperity through trade and capital flows may get tested.
China, China + 1: The economic slowdown that started in China this year has had material implications, especially on commodities, for India. Investors too have found a new growth market in India to invest in. The 'China+1' strategies being discussed across boardrooms are expected to boost India's manufacturing output and intertwine it in global supply chains. We will watch this space to track everything from imports of nanometer semiconductors to large machinery exports from China.
Climate and El Nino: With 2023 being the hottest year and El Nino expected in 2024, global warming records are generally expected to tumble again. What climate change does across industries and societies remains unpredictable in timing and fury. We have seen how sudden heatwaves shrivelled India's wheat output and inundated Pakistan - climate costs can come in the unlikeliest of places and times. Global and local monetary policies: Will we move from "higher for longer" interest rates globally to a calibrated reduction in the cost of money? Will climate, geopolitical, and political changes create reasons to bring back inflation or has it finally been tamed? Lower global cost of funds can help reignite growth and channel monies to emerging markets. New public datasets: India’s rapid digitalisation is enabling new analyses & visualisations, such as our HeatMaps based on toll data. As the digital GatiShakti initiative takes hold and more datasets of Indian infrastructure become public, many new analyses can become possible across sectors like power, transport, cities. and yes,
T20 World Cup: After the heartbreak in Ahmedabad, will India lift the trophy in Bridgetown?
Disclaimer: This Report is not intended to be, and should not be, construed to be any investment and/or divestment related recommendation or nor should it be used as input for any investment/divestment related decision. The use of any data or information set out in this Report is entirely at the recipient’s own risk.