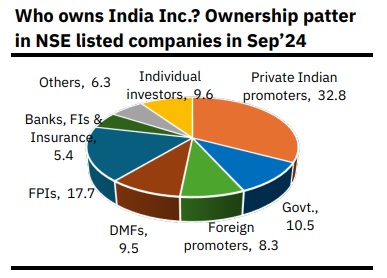
Total promoter ownership in the NSE listed and Nifty 500 companies fell by 46bps and 45bps QoQ to 51.1% and 50.5% respectively, primarily led by a steep drop in Government share, partly offset by an increase in private promoter ownership.


Prerna Singhvi, CFA
Vice President – Economic Policy and Research
National Stock Exchange of India Limited (NSE)
Mumbai, 22 November, 2024: In this edition of the NSE’s quarterly report “India Inc. Ownership Tracker”, the authors extend their analysis of ownership trends and patterns in NSE companies to include the data available for the quarter ending September 2024. Additionally, they also examine concentration of category-wise holding by analysing allocation across market cap deciles and portfolio HHIs-Herfindahl-Hirschman Index. (This is the first part of the series on the quarterly report “India Inc. Ownership Tracker”, with the data available for the quarter ending September 2024.)
We note:
1) A decline in promoter ownership for the first time in six quarters to 51.5% in NSE listed companies, primarily led by a sharp fall in Government share;
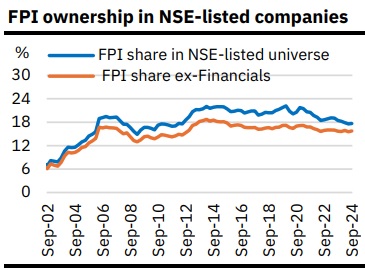
2) A marginal increase in FPI3 (foreign portfolio investors) ownership—the first in six quarters, to 17.7%/18.9% in the listed/Nifty 500 companies, while it remained steady in the Nifty 50 index, indicating widening exposure to mid and smaller companies.;
3) An increase in DMF (domestic mutual funds) share to a fresh record high of 9.5% (Active: 7.7%, Passive: 1.8%), aided by sustained SIP inflows;
4) A steady direct ownership of individual investors as non-promoters at 9.6% in the listed universe; individuals as promoters and non-promoters (direct and indirect) now own nearly a quarter of the total market cap (Rs115 lakh crore; CAGR since 2010: +18.5%);
5) FPIs trimmed their outsized OW4 bet on Financials, turned OW on Communication Services and increased their UW stance on Materials and Industrials;
6) DMFs also turned cautious on Financials, increased OW position on Consumer Discretionary and Healthcare and retained an UW stance on commodity sectors, viz., Energy and Materials;
7) A further drop in the share of Nifty50/top decile companies in the institutional and individuals’ portfolios, reflecting widening exposure to smaller companies. This is also corroborated by falling HHI levels after a brief rise post the pandemic, with a concentrated FPI selling to top 100 companies in October potentially suggesting the continuation of this trend.
• Promoter share declined in the listed universe for the first time in six quarters:
Total promoter ownership in the NSE listed and Nifty 500 companies fell by 46bps and 45bps QoQ to 51.1% and 50.5% respectively, primarily led by a steep drop in Government share, partly offset by an increase in private promoter ownership. For the Nifty 50 companies, promoter share fell for the second quarter in a row by 23bps QoQ to 42.1%, but due to a sharp decline in private Indian promoter share, while Government share rose marginally.
Government share fell on PSU underperformance:
The Government ownership (promoter and non-promoter) in the NSE listed universe and Nifty 500 companies fell by 96bps and 81bps QoQ to 10.5% and 11.3% respectively. This was due to underperformance of Government-owned companies, particularly PSU Banks, during the quarter. For instance, the Nifty PSU Bank Index posted a loss of 8.3% in the September quarter compared to the 7.5% return generated by both Nifty 50 and Nifty 500 Index. The Nifty 50 index, however, saw a 27bps QoQ increase in Government share, marking the fifth increase in a row, thanks to inclusion of a PSU stock (Bharat Electronics) in the Index during the quarter.
• FPI ownership inched up marginally:
Notwithstanding strong foreign capital inflows (US$11.6bn during Jul-Sep’24), FPI ownership inched up only marginally by 9bps and 13bps QoQ in the NSE listed and Nifty 500 companies to 17.7% and 18.9% respectively. A part of this is attributed to relative underperformance of Financials during the quarter where FPIs are heavy owners. In value terms, FPI holding in NSE listed universe rose for the sixth quarter in a row by 8.8% QoQ to Rs 82.7 lakh crore. FPI share in the Nifty 50 Index, however, remained fairly steady at 24.4%.
FPIs turned incrementally cautious on Financials, particularly on smaller companies in the sector, and reduced their OW position. FPIs also reduced their exposure to Energy, with a mildly cautious stance, and strengthened their perennial negative view on India’s investment story by increasing the extent of their UW position on Industrials and Materials. Reduced exposure to these sectors found its way to Communication Services, where FPIs turned OW on in the September quarter. For other sectors, FPIs maintained a neutral stance, with an incrementally positive bias on Consumer Discretionary and IT.
• DMFs’ share rose to fresh all-time high level:
Aided by sustained SIP inflows, DMFs’ share rose further to a fresh all-time high of 11.4%, 9.9% and 9.5% in Nifty 50, Nifty 500 and NSE listed companies respectively. DMFs injected a net amount of Rs 89,336 crore into Indian equities in the September quarter, and record-high monthly amount of Rs 90,771 crore in Oct’24, taking total net inflows to Rs 2.9 lakh crore in the first seven months, already surpassing net annual inflows seen in the past. Out of total share held by DMFs, passive funds’ share inched up slightly to 1.8%, with the balance 7.7% held by active funds, up 22 bps QoQ. 5 In line with FPIs, DMFs also reduced their OW position on Financials, while turning more cautious on smaller companies in the sector. This reduced exposure was allocated to Consumer Discretionary and Healthcare where DMFs strengthened their OW stance in the Nifty 500 companies. DMFs also turned less negative on Consumer Staples and Information Technology, remained bearish on commodity sectors, viz., Energy and Materials and neutral on Real Estate and Utilities.
• Individual investors’ share remained steady in the September quarter:
Individual investors’ direct ownership as non-promoters inched in the NSE listed companies remained broadly steady at 9.6% in the September quarter. This corroborates with moderation in direct participation by individual investors in Indian equities in the quarter gone by (Rs 178 crore in Q2FY25). In the Nifty 50 and Nifty 500 companies, ownership of individual investors fell by a modest 9bps and 7bps QoQ to 7.9% and 8.6% respectively. Adding indirect holding via mutual funds and direct holding as promoters to this, individuals now own nearly a quarter (24.5%) in the NSE listed companies, up from 22.6% in March 2024, 20% in March 2019, and 15.6% over a decade ago (March 2014).
• Declining allocation to Nifty50/top decile companies…:
The share of Nifty 50 companies in total institutional holding remained steady at the lowest level of 60% since the beginning of the analysis (2001-). This is partly attributed to sustained inflows in mid- and small-cap funds during the quarter. Individuals also saw the share of these companies in their overall portfolio falling to a 22-year low of 36.7% in the September quarter, translating into an 11.1pp drop in the last six quarters. This is also reflected in the falling share of institutional and individuals’ investments in top decile companies by market capitalisation. The portfolio allocation of FPIs and DMFs to the top decile companies (~200 companies) fell to a six-and-a-half year and 14-year low of 88.3% and 79.5% respectively. Further, individual investors now have 64.5% of their portfolio invested in the top decile companies, the lowest since 2001. • Falling HHI indicates widening exposure to mid- and small caps: The Herfindahl-Hirschman Index (HHI), a measure of market concentration6, has been steadily falling since a brief rise after the pandemic, reaching its lowest levels across investor categories. For institutional investors, the HHI of domestic mutual funds (DMF) dropped to a 25-quarter low of 137, while FPIs’ HHI fell to a record low of 217, signaling broader exposure to smaller companies. FPIs now hold stakes in over 1,800 stocks, up from 1,200 four years ago. Despite the highest FPI selling in October, this was concentrated in the top 100 stocks, with small and microcaps seeing net inflows. For individuals, the HHI dropped to 66 in the September quarter, marking its lowest level since 2001. However, significant sectoral disparities remain across all investor categories.
( To be continued)
(The contribution acknowledged of Shantanu Sharma, Abhijay Nair, Dhruvi Shah, Mihir Raravikar, Ranjeet Singh and Shashidharan Sharma (Research Associates) to this publication.)
Disclaimer: This report is intended solely for information purposes. This report is under no circumstances intended to be used or considered as financial or investment advice, a recommendation or an offer to sell, or a solicitation of any offer to buy any securities or other form of financial asset. The Report has been prepared on best effort basis, relying upon information obtained from various sources, but we do not guarantee the completeness, accuracy, timeliness or projections of future conditions provided herein from the use of the said information. In no event, NSE, or any of its officers, directors, employees, affiliates or other agents are responsible for any loss or damage arising out of this report. All investments are subject to risk, which should be considered prior to making any investment decisions. Consult your personal investment advisers before making an investment decision.