Role of Capital Market in Financialisation of Savings; Mutual fund gross mobilization moves south and north: Direct channels gaining traction


Dr. Soumya Kanti Ghosh
Group Chief Economic Adviser
State Bank of India, Corporate Centre
Mumbai, 23 December, 2024: SEBI is spurring Democratization of Capital Markets, ushering in innovations through a confluence of regulatory emblems, technological guardrails, investor centricity and increased awareness.... since 2021, on an average 30 million new demat accounts added every year...Nearly every 1 in 4 now a women investor...1% rise in market capitalization leads to 0.06% rise in GDP growth rate.
India’s Savings Rate is higher than the global average
❑ Due to various measures, India’s financial inclusion improved significantly and now more than 80% of adults in India have a formal financial account, compared to ~50% in 2011, which is improving the financialization of savings rate of Indian households
❑ India savings rate is at 30.2%, which is higher than the global average of 28.2%
Breakup of Household Savings
❑ The share of net financial savings in total household savings has increased from 36% in FY14 to ~52% in FY21, however during FY22 & FY23, the share has decelerated..FY24 trends reveal that the share of physical savings have again started to decline
Breakup of Financial Savings
Among financial savings, the share of bank deposits/currency is declining as new avenues of investment are emerging (like
mutual fund, etc.)
Capital Raised from the Primary Market through Public and Rights Issues
❑ In the last 10-years, funds mobilized by Indian companies from capital markets has increased more than 10-fold, from Rs12,068 crore in FY14 to Rs 1.21 lakh crore in FY25 (till Oct)
❑ The savings of households in ‘Shares and debentures’ has increased to ~1% of GDP in FY24, from 0.2% in FY14 and the
share in household financial savings has increased from 1% to 5%
❑ It shows that the households are now increasingly contributing to the capital needs of the country
Region-wise Distribution of Capital Mobilized through Public and Rights Issues (Equity)
❑ In FY25 (till Oct), a total of Rs 1.21 lakh crore of capital was raised from equity markets from 302 issues
❑ If we look at the region-wise data, Western region’s share in both number and value is higher, and the share of central
region is below 3%
Increasing M-cap leads to increase in average trade size in equity cash segment....
❑ The NSE market capitalization has increased by more than 6x to Rs 441 lakh crore in FY25 (so far) as compared to FY14
❑ Owing to this, the average trade size in equity cash segment has increased from Rs 19,460 in FY14 to Rs 30,742 in FY25 (so far)
.....As 30 Million Demat Accounts Added Every Year
❑ Since 2021, on an average ~30 million new demat accounts are added every year indicating increasing prevalence of using capital market as a channel of financialization of savings
❑ This year’s number may cross the 40 million mark
❑ Owing to this, total demat accounts in the country crossed 150 million (of which ~92 million are unique investors on NSE) in FY24 as compared to a paltry 22 million in FY14
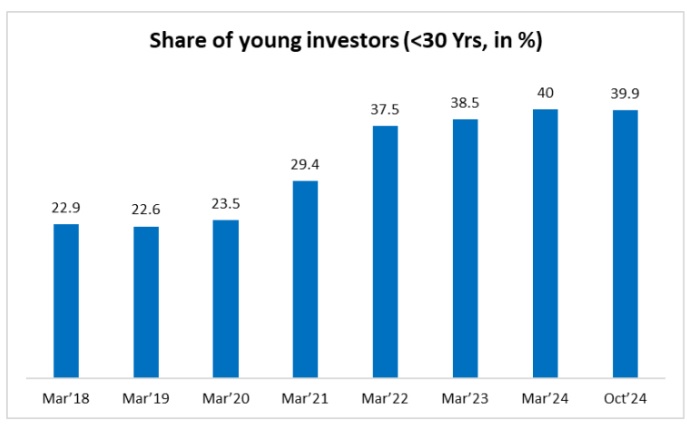
Young Investors are shaping the financial landscape of Viksit India
❑ Declining mean/median age and increasing share of less than 30-year age individuals reflect the influx of relatively younger
investors in the markets over the last few years, driven by technological advancements, lower trading costs and increased access to information
DBT and Investor Base moving together
❑ 8 out of top-10 states (based on DBT performance rankings) have shown an increase in share of total registered investors
❑ Direct benefits, without leakages, is not only increasing consumption abilities but also leading to a rise in savings of
beneficiaries, thus fostering a more inclusive financial ecosystem
Female participation has increased gradually since FY22
❑ Women participation in individual investor registrations has shown a gradual increase since FY22
❑ Among large states, Delhi (29.8%), Maharashtra (27.7%) and Tamil Nadu (27.5%) exhibit higher female representation than the pan India average of 23.9% in FY25 YTD, while states such as Bihar (15.4%), Uttar Pradesh (18.2%) and Odisha
(19.4%) had sub-20% female share in their respective registered investor bases
❑ Also, apart from a few states, the participation of women increased more than national average in FY25 as compared to FY22
❑ Despite these regional variations, the overall progress highlights a steady improvement in gender inclusion within financial markets across the country
Mutual Fund is the most preferred means to channelize savings
❑ The increasing share of mutual funds in financial savings make them the most preferred instrument for financialization of savings
❑ The new SIP registered increased fourfold since FY18 to 4.8 crore leading to total SIP contribution of around Rs 2 lakh crore
Mutual fund gross mobilization moves south and north: Direct channels gaining traction
Government and Regulator trying to protect investors money
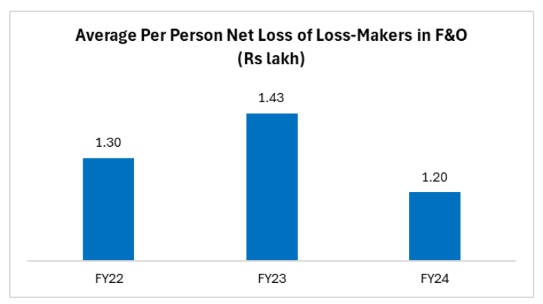
❑ While capital market is a better avenue to financialization of savings, the prevalence of F&O trading is a cause of worry
❑ As per SEBI, 91.1% of Individual F&O traders (about 73 lakh traders) incurred losses in F&O in FY24. These loss-makers incurred an average loss of Rs 1.20 lakh per person (lower than Rs1.43 lakh per person in FY23)
❑ Owing to this, both Government and regulator has taken various initiatives to protect savings of individuals (like tax on F&O, increase in lot size, etc.)
Market capitalization augmenting Real economy...
❑ To find out the impact of booming market on the real economy, we have
estimated a VAR model for the period FY95 to FY24
❑ The model specification with one lag length based on AIC is:
Yt = α0 + β0
.Yt-1 + β1Xt-1 et
Xt = α1 + λ0
.Xt-1 + λ1Yt-1 e1t
where Y represents GDP growth
X represents market capitalization growth
❑ The results indicate that 1% rise in market capitalization leads to 0.06% rise in GDP growth rate
❑ Using granger causality, we find that growth in market capitalization granger causes growth in GDP. However, the causality does not follow from GDP to market capitalization
Impulse response delineates positive dynamic linkage...
❑ Impulse response has been used to capture the dynamic effect of impulse variable (market capitalization) to response
variable (GDP)
❑ The impulse response shows that 1 standard deviation shock in market capitalization has a positive impact on real economy
with the impact drying out after three time periods
❑ A higher market capitalization signals robust economy and higher investor confidence consequently driving overall economic growth
Ownership trend in Nifty 50 market cap...
❑ Domestic MFs showing an increasing trend, while retail investors’ share declined to 7.9% in Sep’24
Sectoral allocation of NIFTY 50 universe
❑ Retail investors increased their share in Consumer Discretionary by 2.7% in Sep’24 from Mar’24, Domestic MFs increased the
same by 1.5% and FIIs by 1.6% in the same period
❑ Highest share decline was is in energy sector, which was 1.1% by retail investors, 1.3% by DMFs and -2% by FIIS in the
above said period
Indian Indices have trumped broader cohorts by a wide margin in MSCI....
FPI Inflows Post Pandemic have been Asymmetric... Debt Preferred Over Equity
Post pandemic, 2020-21 witnessed huge equity inflows as stretched, below par valuations of stocks across board attracted global funds gushing in.... Next two years were characterized by outflows (higher in 2021-22) which could be due to profit taking from short term players... Overall flows were robust in 2023-24 as rates were held still... 2024-25 (YTD) has been neutral for equities (adjusted for huge outflows in October post Fed action) while debt inflows have remained resilient... It would be the ability to attract long term players like SWFs and Pension funds to participate in India’s growth story that will write the shape our capital markets....