The ‘missing’ Rs 6 lakh crore / Rs 42 lakh crore in Nominal GDP during Q1 FY26/ Q1FY23-Q2 FY26, is a badly scripted piece of fiction devoid of any logic. SBI Research was one of the few firsts, in its report dated 02 Sep’26, to highlight that comparing two altogether different base year series was frivolous and a sure sign of intellectual dishonesty.
FinTech BizNews Service
Mumbai, 8 September, 2026: The State Bank of India’s Economic Research Department has come out with a special research report focused on the missing adjustment of Rs 6 lakh crores in nominal GDP. The report has been authored by Dr. Soumya Kanti Ghosh, Group Chief Economic Adviser, State Bank of India.
Some stories are seeped in facts, while some are entirely fictional, a loose figment of irrational tit-bits of imagination stitched haphazardly. The rancorous story being peddled by some Intellectual poseurs, bordering charlatanism, notably that of the ‘missing’ Rs 6 lakh crore / Rs 42 lakh crore in Nominal GDP during Q1 FY26/ Q1FY23-Q2 FY26, is a badly scripted piece of fiction devoid of any logic. SBI Research was one of the few firsts, in its report dated 02 Sep’26, to highlight that comparing two altogether different base year series was frivolous and a sure sign of intellectual dishonesty.
Four questions, political as also economic have emerged post the declaration of Q1GDP numbers at 7.8% that we believe may require a broad discussion. First, the discussion on large revisions in nominal GDP. Second, the breakdown of such downward revisions mapped to sectors. Third, why the deflator is so low and is in complete contrast to high WPI and CPI numbers during Q1FY27. Fourth, one does not feel the 7.8% GDP growth and the leading indicators are not even tracking a buoyant GDP over a longer period with private investment still a lag gard. We provide answers to all these issues in this report.
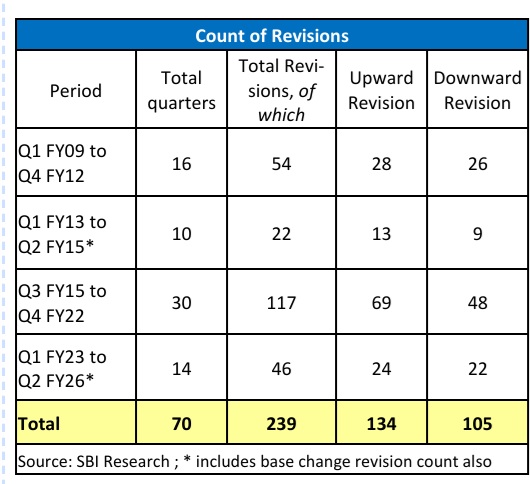
Firstly, as per World Bank, larger revisions in national accounts may be needed when a new reference year for constant-price series are introduced. Since India has a history of GDP base year revisions in FY05, FY12 and most recently FY23, we find there are 239 revisions beginning FY09 over 70 quarters of which 134 has been in upward direction and 105 in downward direction. Clearly, the extent of revisions is random and has absolutely no set pattern across any political regime as is now being claimed. However, in terms of change in nominal GDP, the 14 quarters beginning Q1FY23 and ending Q2FY26 was witness to Rs 41.8 crores revision, while the 56 quarters preceding Q1FY23 revealed a revision of a lesser magnitude of Rs 10.1 lakh crores. Why this difference?
Secondly, we believe the answer to the question above lies in the new methodology that was rolled out with FY23 as the base year. For example, the downward revision in GVA under the new series stands at Rs41.1 lakh crore for Q1 FY23–Q2 FY26, but its sectoral composition is more revealing than the aggregate itself. 95% of the revision is largely concentrated in Trade, Hotels, Transport and Communication (−Rs39 lakh crore), while Finance, Insurance, Real Estate and Business Services record a positive revision of Rs13.6 lakh crore. The contrasting move ment can therefore be viewed as a significantly better mapping of the composition of economic activity across informal/unincorporated sectors using ASUSE and PLFS with a granularity, instead of using proxy indicators for mapping informal sector in the regime before FY23.
Trade and related services have a substantial presence of unincorporated enterprises, where the incorporation of direct ASUSE and PLFS information provides a more refined measurement, while the richer corporate and administrative data improve the capture and allocation of activity in Finance and related formal-sector services. This was clearly absent in the earlier base year changes and sans this sub-sector the overall change drops to mere Rs 2.1 lakh crores. If we take the example of say FY17, the results reveal the shortcomings of the earlier GDP methodology in not being able to capture movements in GDP in times of policy changes. Interestingly, this subsequent movement from Trade towards Finance and related formal-sector activities can also be viewed alongside the broader process of formalization and financialization of the economy through greater banking penetration, digital payments and the expansion of formal financial channels.
There is another issue of such revisions, that of the changes in real GDP. For the 14 quarters beginning Q1FY23 and ending Q2FY26 was witness to Rs 372 lakh crores upward revision in GDP on a cumulative basis. During the 10 quarters beginning Q1FY13 and ending Q2FY15, real GDP jumped by a large Rs 90.1 lakh crores, even though nominal GDP changed by only Rs 20,000 crores. Clearly, there is again no set pattern in GDP changes, be it nominal or real GDP. We believe that large decline in nominal and the large increase in real GDP in the new GDP series indicate the enhancement of the purchasing power of the people as overall price levels dropped faster than the physical output of the economy grew. This also means availability of same goods at lesser prices.
Thirdly, there has been considerable debate over whether the publicly available data are sufficient to independently reconstruct the deflators used in the new GVA methodology. Our exercise demonstrates that the required information is, in fact, sufficiently available to construct reasonable proxies consistent with the underlying methodology and is in direct contrast to the commentary in public domain by noted economists who have held respectable Government positions previously.
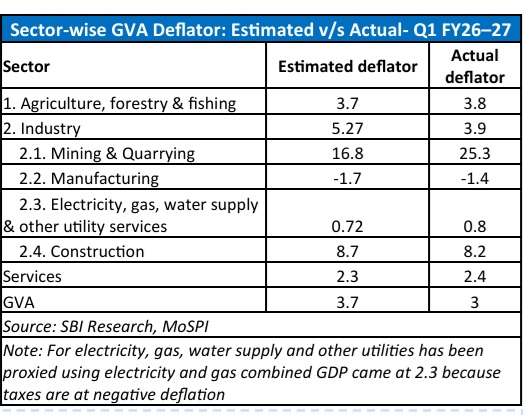
Using publicly available price and volume indicators and applying the same broad logic of double deflation for agriculture and industry and single extrapolation for services, we obtain an agricultural GVA-deflator inflation of 3.74% in Q1 FY27, very close to the MoSPI-implied 3.77%. For industry, our estimates for Q1 FY27 are 16.77% for Mining, 0.72% for Electricity and Gas, and 8.66% for Construction; the manufacturing deflator estimate is −1.67%, compared with −1.3% implied by MoSPI, with the negative outcome arising because input-price inflation exceeding output-price inflation Similarly, our estimated services deflator inflation of 2.30% compares closely with the 2.4% MoSPI estimate. Our overall deflator with information available results in a 3.7% GVA deflators against MoSPI estimate of 3%. Through this exercise, we have shown that with the availability of publicly accessible price and volume indicators, the broad contours of the new deflator methodology can be replicated, and the resulting estimates are closely aligned with the MoSPI-implied rates across sectors. Clearly, not being to able to construct the deflator does not mean that the task cant be done.
Finally, a word on the leading indicators. There is sufficient strength in broad based indicators post pan demic that justifies GDP growth has consistently been at more than 7% since FY23. If underlying GDP growth were indeed substantially below 7.8%, the continued robust performance of key high-frequency indicators would be difficult to reconcile, in harmony with such a sharp moderation in aggregate activity. Even in terms of private sector investment, it has averaged Rs 3.5 lakh crores every year since FY23. This is already higher than Rs 3.3 lakh crores for the 6 year ended FY19.
Let us end with a Bayesian analogy. People hear not merely what is said, but what their prior beliefs permit them to hear. Like perfect Bayesians with dogmatic priors, they assign inconvenient possibilities (often realities) a probability of zero. So, no amount of new evidence can revive them. Their expectations then shape their behaviour, producing the very outcomes they anticipated. Hard facts arrive, but instead of updating their beliefs, they reinterpret the facts until the world once again resembles what they already believed.
Flippantly, casting doubts on the GDP data akin to casting doubt on the qualifications and integrity of galaxy of experts that constituted the committees. The details of the committee members is attached on the last page for reference.
