Has capacity utilization for India Inc. improved in H1?
A way of looking at capacity utilization in the economy is through the lens of ratio of turnover to fixed assets ratio of India Inc. especially for the non-financial sector
Dipanwita Mazumdar
Economist,
Bank of Baroda
Mumbai, November 24, 2023: Depressed sales in H1-FY24 has impacted the turnover to fixed asset ratio of India Inc. This ratio is a closely used proxy for capacity utilization rate of the non-financial sector, in particular. Fixed asset creation has still picked up in H1, with auto companies among others hinting at expanding its total production capacity. Even crude oil and infrastructure companies have spoken of balanced capex and growth mix, with former hinting at production augmentation plans. However, what has been a concern is the muted growth in sales in comparison to the existing stock of fixed assets. This held for industries such as chemicals and consumer durables where some momentum was visible in H1FY23, but is now losing steam due to depressed sales. Some core capital goods sectors such as infrastructure and iron and steel have held up well.
- Turnover to Fixed assets ratio of companies, which can be used as a proxy for capacity utilization of the economy, has witnessed moderation in H1FY24 compared to H1FY23. However, it was higher than that in 2019, 2020 and 2021.
- Excluding Banking and financial services (BFSI) the ratio has also come off, albeit higher than the pre pandemic level.
- Depressed level of sales compared to pace of asset creation has resulted in the same.
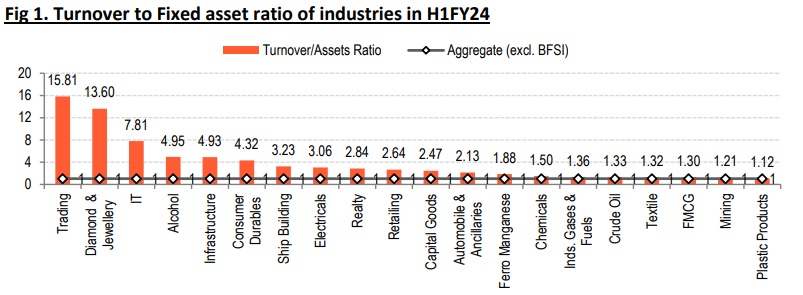
- Sectoral data shows infrastructure, consumer durables and ship building were at the top end of the spectrum. Major infra related sectors such as capital goods, auto and ancillaries and chemicals were in the median range.
What H1 numbers reflect?
- A way of looking at capacity utilization in the economy is through the lens of ratio of turnover to fixed assets ratio of India Inc. especially for the non-financial sector. Here we analyzed balance sheets and P/L data of 1,982 companies for H1FY24. Excluding BFSI companies, the count comes to 1,752 companies. For turnover, we have used the half yearly net sales data and for fixed assets we have used the sum of fixed assets and Capital work in progress.
- The H-1 data for the aggregate sample has moderated to 1.25 from 1.29, seen in the corresponding period of previous year. Excluding BFSI sector, the turnover to fixed asset ratio has come off to 1.04 from 1.14 in H1FY23, albeit remaining above the pre pandemic level of 0.80, seen during H1FY19. Interestingly RBI data for Q1FY24 showed capacity utilization rate of the economy moved down to 73.6% from 76.3% in Mar’23. The main reason behind this is the softening of sales numbers which is visible since the beginning of this financial year and the trend is continuing this quarter as well. Notably, if we exclude the outlier industries (trading, diamond and jewellery and IT) which have an inflated turnover to fixed assets ratio, due to their inherent way of functioning, the ratio is below 1 at 0.98. 2
Industry wise picture:
- Industries such as infrastructure, electricals and realty were at the top end of the spectrum, posting a better ratio in H1FY24. Major infra related sectors such as capital goods, auto and ancillaries and chemicals were in the median range while telecom, power, construction materials, gas transmission and iron and steel were at the bottom. Noticeably industries related to intermediate goods are the ones where fixed asset creation happens at a faster pace than consumer centric industries where focus is on sales. Thus these industries have a tendency of depressed turnover to asset ratio.
- 18 of the 32 industries captured in this analysis registered a decline in turnover/assets ratio in H1-FY24. But interestingly, with the exception of alcohol, FMCG, consumer durables and ship building (albeit a very small sample size), all other industries had higher ratios compared with pre-pandemic times.
- If we compare the H1-FY24 ratio with H1-FY23, 92.5% of companies in our sample have registered a drop in turnover, while only 45% of the industries have noted drop in their pace of fixed asset creation in H1-FY24 compared to H1-FY23. This has brought down the overall turnover to asset ratio of the sample. Only for infra, the ratio has shown some degree of momentum in H1-FY24 compared to H1-FY23 (+52bps increase in ratio). This was driven by improvement in ratio of companies related to Transmission Towers/Equipment. Other than infrastructure, Automobile & Ancillaries also showed 15bps increase in the ratio largely driven by lower pace of creation in fixed assets rather than improvement in sales numbers.
- For sectors such as chemicals, industry gas and fuels and consumer durables, the drop in ratio was more on account of sharp drop in sales compared to that of fixed assets. In case of crude oil, increase in pace of asset creation as is the trend historically, has led to a lower ratio of the sector. For Iron and Steel sector, despite an improvement in fixed asset creation, fairly stable sales numbers have supported the ratio.
- However, what comes as a comfort is that despite some moderation in the overall ratio, 68% of companies have shown a ratio which is higher than the aggregate sample. So there is some in-built momentum that is prevalent. These companies were in sectors such as automobiles, capital goods, consumer durables, crude oil and infrastructure. However, Power, Telecom and construction materials due to their inherent nature disappoint on this front.
(The views expressed in this research note are personal views of the author(s) and do not necessarily reflect the views of Bank of Baroda. Nothing contained in this publication shall constitute or be deemed to constitute an offer to sell/ purchase or as an invitation or solicitation to do so for any securities of any entity.)
