At end-March 2023, PSBs accounted for 61.4 % of total deposits of SCBs and 57.9 %of total advances


FinTech BizNews Service
Mumbai, December 28, 2023: The Reserve Bank of India released the Report on Trend and Progress of Banking in India 2022-23, a statutory publication in compliance with Section 36 (2) of the Banking Regulation Act, 1949 on Wednesday. This Report presents the performance of the banking sector during 2022-23 and 2023-24 so far.
Balance Sheet Analysis of SCBs
During 2022-23, the combined balance sheet ( B/s) of commercial banks expanded in double digits, driven by sustained credit growth. Lower slippages helped improve asset quality across all bank groups, with GNPA to total advances ratio of SCBs dropping to a 10-year low. Higher lending rates and lower provisioning requirements helped to improve the profitability of banks and shored up their capital positions.
At end-March 2023, the Indian commercial banking space comprised 12 public sector banks (PSBs), 21 private sector banks (PVBs), 44 foreign banks (FBs), 12 SFBs, six PBs, 43 RRBs and two LABs. Of these 140 commercial banks, 136 were classified as scheduled while four banks were nonscheduled1. The consolidated balance sheet of SCBs (excluding RRBs) grew by 12.2 % in 2022-23, the highest in nine years. The main driver of this growth on the asset side was bank credit, which recorded its fastest pace of expansion in more than a decade. Deposit growth also picked up, although it trailed credit growth, resulting in higher recourse to borrowings. This was particularly evident in the case of PSBs, for which the deposits to liabilities ratio moderated.
The share of PSBs in the consolidated balance sheet of SCBs declined from 58.6 %at end-March 2022 to 57.6 % at end March 2023, while PVBs gained share from 34.0 %to 34.7 per cent. At end-March 2023, PSBs accounted for 61.4 % of total deposits of SCBs and 57.9 %of total advances.
Liabilities
The aggregate deposits of SCBs picked up pace during 2022-23, led by term deposits of PVBs, benefitting from higher term deposit rates spurred by policy rate hikes during May 2022 – February 2023 and moderation of surplus liquidity. Interest rates on savings bank deposits — which account for around 31.4 %of total deposits — remained largely unchanged, which helped banks to post higher net interest margins (NIMs).
Assets
Bank credit growth remained buoyant during 2022-23 and 2023-24. The year-on-year (y-o-y) credit growth at end-November 2023. was 16.2 per cent. PSBs’ share in incremental credit increased during 2022-23 to reach 46.5 %at end-November 2023. IV.7 At end-March 2023, 81.2 %of SCBs’ investments were in government securities (G-secs). SLR investments of SCBs rose by 14.2 %in 2022-23 as compared with the growth of 9.0 %in the previous year, which pulled up the incremental investment-deposit (I-D) ratio. The held to maturity (HTM) limit of 23 %for SLR eligible securities was extended up to March 31, 2024 and banks were allowed to include securities acquired between September 1, 2020 and March 31, 2024 within the enhanced HTM limit3. IV.8 The credit to deposit (C-D) ratio of banks increased from 74.9 %at end November 2022 to 77.0 %at end November 2023, on account of robust credit growth.
Maturity Profile of Assets and Liabilities
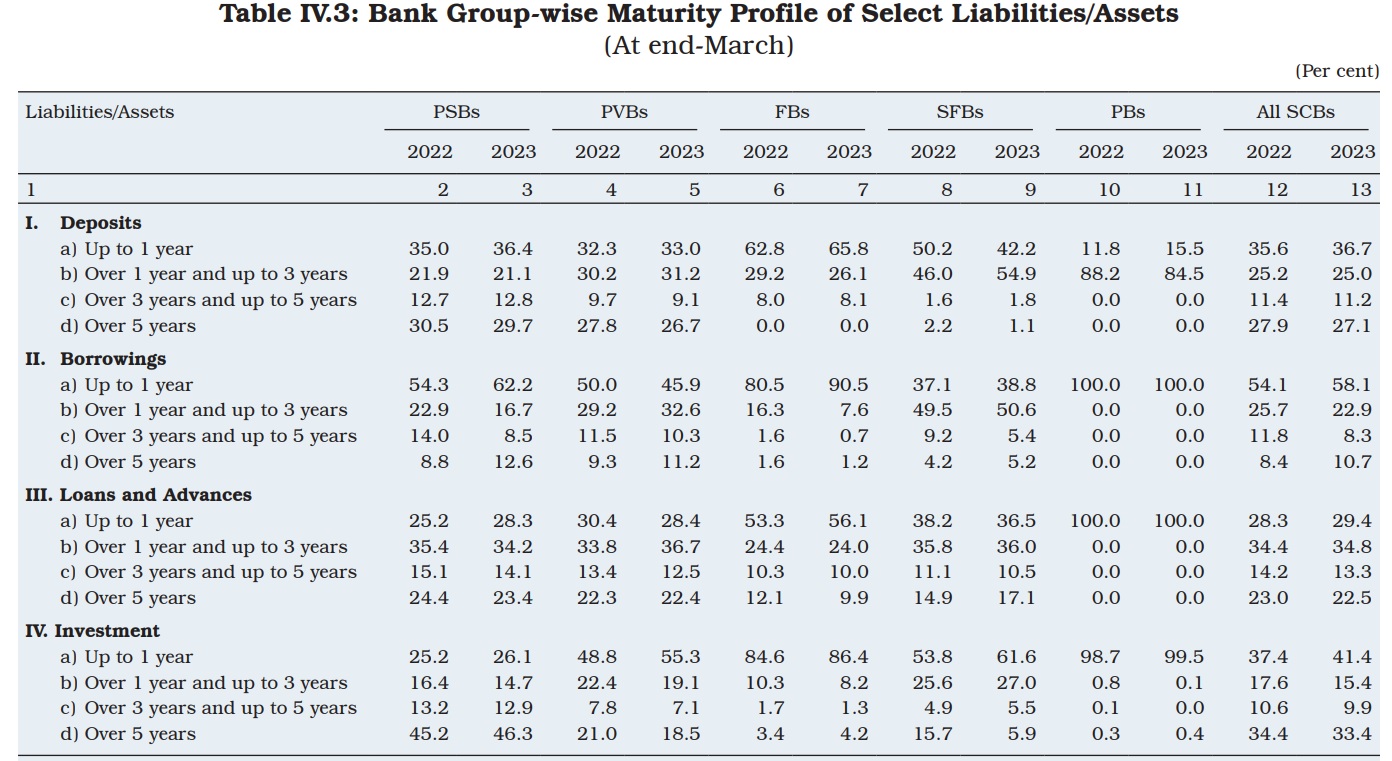
Mismatches in the maturity of assets and liabilities are intrinsic to the banking sector as deposits − their primary source of funds − have short- to medium-term maturities, while the repayment schedule of their loans typically stretches across the medium-term. As asset-liability mismatches expose them to interest rate risk and liquidity risk, careful monitoring and management assumes importance. During 2022- 23, the maturity mismatch moderated in the short-term bucket. The gap between assets and liabilities in the maturity bucket of over five years increased as banks took recourse to long-term borrowings.
All bank groups exhibited higher reliance on short-term borrowings relative to medium- to long-term borrowings, except SFBs. PVBs increased the share of their medium and long-term borrowings during 2022-23. PSBs’ investments are typically in long-term instruments, while private sector counterparts prefer short-term exposures.
International Liabilities and Assets
In 2022-23, international liabilities of Indian banks expanded in double digits on the back of 28.5 %y-o-y growth in the foreign currency non-resident (Bank) (FCNR(B)) deposits, reversing the fall of (-) 21.2 %in the previous year. With effect from July 07, 2022, the Reserve Bank temporarily withdrew the interest rate ceiling on incremental FCNR (B) deposits until October 31, 2022, which made FCNR(B) deposits relatively attractive. IV.12 Another factor which influenced the growth in international liabilities was a 20.0 %y-o-y growth in equities of banks held by non-residents, up from 8.7 %in the previous year. Based on the latest BIS guidelines, mark-to-market (MTM) derivatives have also been included in the international liabilities from September 2022, which constituted 3.4 %of their liabilities at end-March 2023.
On the other hand, international assets of banks in India contracted by 13.1 % in 2022-23 as compared with a growth of 9.0 %a year ago. The fall in assets in 2022- 23 was on account of a reduction in overseas loans and holdings of international debt securities as banks deployed resources to fund domestic credit. Consequently, the international assets to liabilities ratio of banks in India reduced at end-March 2023, after increasing for three consecutive years.
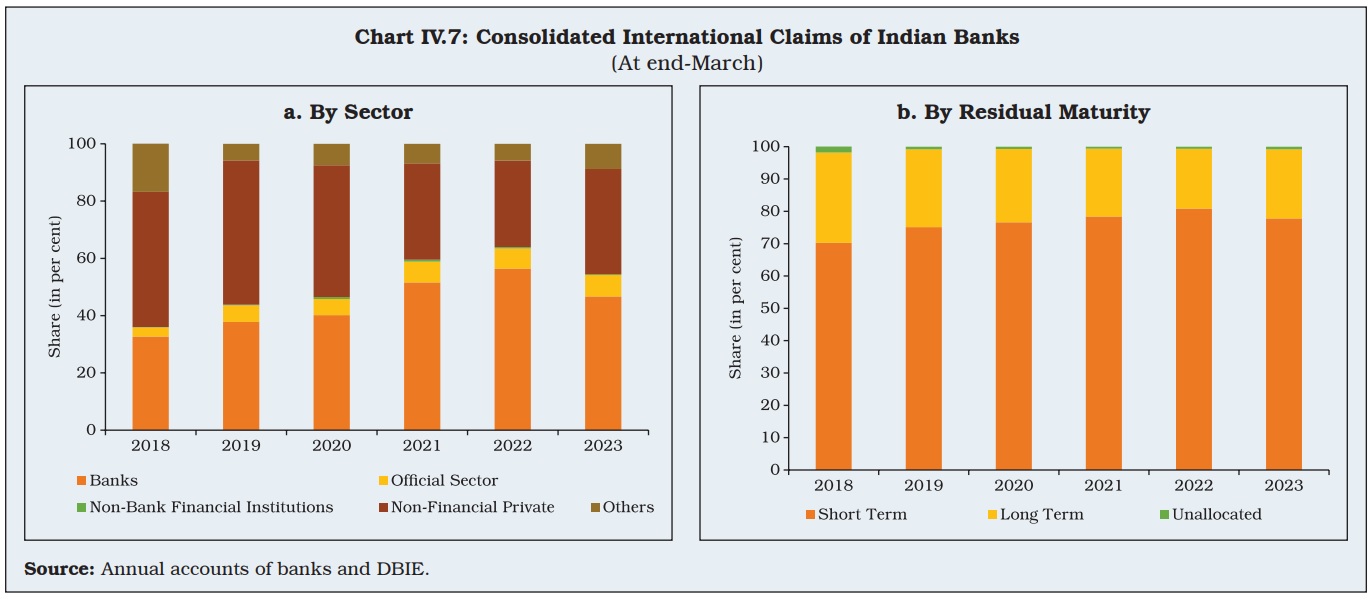
Banks’ consolidated international claims decelerated for all major economies, except Singapore. At end-March 2023, their claims shifted away from banks towards non-financial private sectors. The proportion of longer maturity claims increased, although short-term claims remained the dominant category.
Off-Balance Sheet Operations
Contingent liabilities of SCBs grew by 22.4 %in 2022-23, led by growth in forward exchange contracts. As a proportion to balance sheet size, contingent liabilities of SCBs increased from 132.8 %at end-March 2022 to 144.8 %at end March 2023, with those of PSBs decreasing in 2022-23 to 36.5 %from 41.5 %in 2021-22. FBs’ contingent liabilities are more than 12 times their balance sheet size and constituted 55.3 %of the banking system’s total off-balance sheet (OBS) exposures.
Financial Performance
The trend of improvement in the profitability of SCBs, which began in 2019- 20, continued for the fourth consecutive year in 2022-23, aided by higher income and lower provisions and contingencies. Both return on assets (RoA) and return on equities (RoE) improved in 2022-23.
Interest expended by SCBs had contracted for two consecutive years (2020-21 and 2021-22) reflecting the accommodative monetary policy stance. With a turn in the interest rate cycle, both interest income and interest outgo rose in 2022-23; as the expansion in interest income exceeded interest outgo, net interest income in 2022-23 was higher than in the previous year.
Supervisory data indicate that interest income from loans and advances grew by 24.0 %during 2022-23 and by 14.6 %from investments. On other hand, the interest expended rose by 18.1 per cent5. On balance, the NIM of banks increased by 36 bps to reach 3.8 %in 2022-23. During 2022-23, risk provisions of SCBs declined on account of lower slippages as also higher write-offs, upgradations and recoveries. This boosted banks’ net profits6, along with support from higher earnings Moreover, as asset quality improved, the provision coverage ratio (PCR) (without write-off adjusted) rose to 75.3 %by end-September 2023.
The spread between return on funds and cost of funds increased for SCBs. SFBs had wider spreads relative to other bank groups, reflecting relatively higher interest rates on advances.