Pvt Banks Relying Heavily on Higher-Cost TDs, CDs
Intense competition across mortgage lending and high-rated corporate loans limits banks' ability to pass on further rate hikes to borrowers, leading to margin compression of 10–18 bps on blended margins.
FinTech BizNews Service
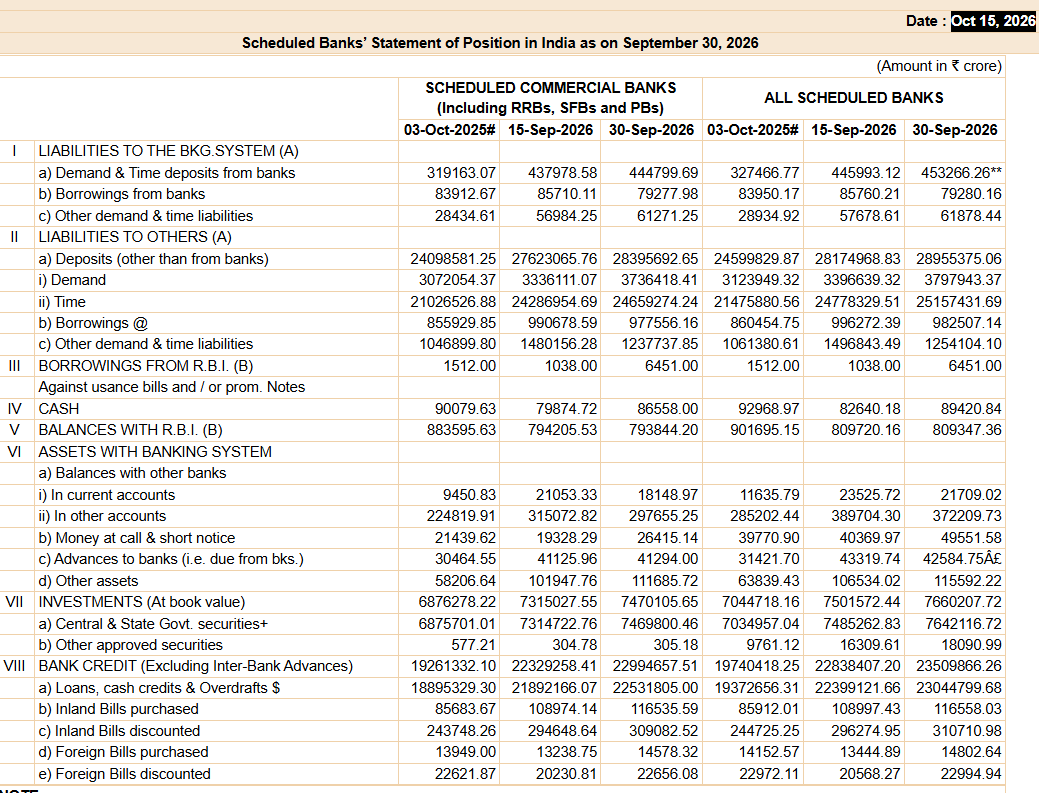
Mumbai, 16 October, 2026: Scheduled Commercial Banks (SCBs) posted a healthy 19.38% YoY credit growth alongside a 17.83% YoY deposit expansion as on September 30, 2026, based on the RBI Statement of Position, released on Oct 15, 2026.
The data highlights a surge in half-year-end balance sheet activity, marked by sharp expansions in both demand deposits and overall bank credit.
Summary of Key Aggregates (Scheduled Commercial Banks)
Metric | September 30, 2026 | September 15, 2026 | YoY Growth (%) | Fortnightly Change (%) |
Bank Credit | Rs22,99,466 cr | Rs22,32,926 cr | +19.38% | +2.98% |
Aggregate Deposits | Rs28,39,569 cr | Rs27,62,307 cr | +17.83% | +2.80% |
Demand Deposits | Rs3,73,642 cr | Rs3,33,611 cr | +21.63% | +12.00% |
Time Deposits | Rs24,65,927 cr | Rs24,28,696 cr | +17.28% | +1.53% |
Investments (G-Secs & Approved) | Rs7,47,011 cr | Rs7,31,503 cr | +8.64% | +2.12% |
Credit-Deposit (CD) Ratio | 80.98% | 80.84% | — | +14 bps |
Core Drivers and Balance Sheet Trends
- Quarter-End Deposit Influx: Aggregate deposits surged by Rs77,262 crore (+2.80%) during the fortnight. The surge was driven by a 12.00% fortnightly jump in Demand Deposits, reflecting standard quarter-end balance buildups and corporate tax outflows settling into current accounts.
- Credit Expansion Pace: Gross bank credit advanced by Rs66,541 crore (+2.98%) fortnightly, outpacing deposit accretion and holding the system CD ratio elevated at 81%.
- G-Sec Mobilization: Investments in government and other approved securities reached Rs7,47,011 crore (+8.64% YoY), signalling steady statutory liquidity ratio (SLR) compliance amid expansion.
- Inter-Bank & Liquidity Position: Cash and balances with the Reserve Bank hovered around Rs8,80,402 crore, while central bank repo/refinance borrowings increased modestly to Rs6,451 crore over the reporting fortnight.
- Food Procurement Credit: Food credit outstanding for commercial banks declined to Rs96,286 crore (from Rs1,09,721 crore on Sept 15), while cooperative banks held steady at Rs52,074 crore.
- Public Sector Banks (PSBs) and Private Sector Banks (PVBs) diverged across credit accretion efficiency, deposit repricing pressures, and incremental Credit-Deposit (CD) ratios during Q2 FY27.
Public Sector vs. Private Sector Performance (Q2 FY27)
- Deposit Mobilization & Casa Stickiness:
- PSBs captured a disproportionate share of the fortnight's Rs40,031 crore surge in Demand Deposits (+12.00%), driven by treasury tax flows, government disbursements, and deep corporate transaction banking networks.
- PVBs continued relying heavily on higher-cost term deposits and Certificate of Deposits (CDs) to sustain retail loan pipelines, keeping their deposit costs sticky.
- Credit Composition & Market Share:
- PSBs maintained dominance in heavy infrastructure, large corporates, and sovereign-linked capex, where lending yields are lower but risk weights and delinquency profiles remain benign.
- PVBs targeted higher-yielding retail loans, SME working capital, and unsecured credit, yielding higher spreads but requiring elevated provisions and higher capital conservation.
- Stock CD Ratio Comparison:
- PVBs operated with an elevated CD ratio ranging between 84% and 86%, remaining closer to regulatory inspection thresholds.
- PSBs sustained a comfortable buffer at 74% to 76%, leaving ample structural headroom for credit deployment without aggressive deposit bidding wars.
Incremental Credit-Deposit Ratio & Implications for NIMs
- Incremental CD Ratio of 86.12%: For every Rs100 of new deposits brought in over the fortnight, Scheduled Commercial Banks lent out Rs86.12. On an annual basis, the incremental CD ratio stands at 86.88%.
- Stock CD Ratio Headroom: With the overall stock CD ratio at 80.98%, banks are stretching asset-liability profiles to the upper bound of comfortable liquidity standards.
- Net Interest Margin (NIM) Compression:
- Lagged Deposit Repricing: Time deposits expanded 17.28% YoY at prevailing cycle-peak rates. As older low-cost deposits mature into higher-yield brackets, the cost of funds (CoF) faces upward pressure.
- Yield Capping on Advances: Intense competition across mortgage lending and high-rated corporate loans limits banks' ability to pass on further rate hikes to borrowers, leading to margin compression of 10–18 bps on blended margins.
RBI Liquidity Operations (VRR/VRRR) vs. Reserve Balances
- System Reserve Levels: SCB balances with the Reserve Bank of India (RBI) stood at Rs8,80,402 crore, reflecting quarter-end statutory cash reserve ratio (CRR) compliance and tax outflow friction.
- Shift to Variable Rate Repos (VRR):
- Mid-September advance tax collections pulled systemic liquidity into transient deficits, prompting the RBI to deploy fine-tuning Variable Rate Repo (VRR) auctions of 1-day to 14-day tenors to prevent overnight call rates from breaching the MSF ceiling.
- Sterilization via VRRR:
- Following the month-end government spending push, liquidity briefly flipped back to surplus territory. The RBI calibrated absorption through Variable Rate Reverse Repo (VRRR) windows to anchor the Weighted Average Call Rate (WACR) firmly around the Policy Repo Rate.
- Central Bank Borrowing Stance: RBI refinance and repo borrowings by commercial banks rose to Rs6,451 crore, reflecting tactical liquidity management during the reporting window.