ECONOMY EXPANDED BY 7.3% ON AN AVERAGE DURING FY24-FY26: MANUFACTURING SECTOR EXPANDING BY 11.2%, SERVICES AT 8% AND AGRICULTURE AT 3.1%
Dr. Soumya Kanti Ghosh
Group Chief Economic Adviser
State Bank of India
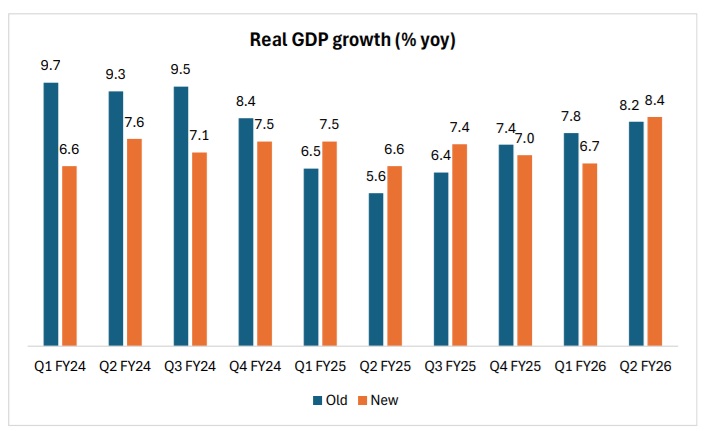
Mumbai, 27 February 2026: India's Q3FY26 GDP eased to 7.8% from 8.4% in Q2 under new series. FY26 growth was at 7.6% in the new series. In new series, FY24 number has been revised downward to 7.2% from 9.2%, while FY25 numbers revised upward to 7.1% from 6.5%. Interestingly, if we look at the levels the real GDP has increased significantly in new base when compared to old base because of better coverage and use of double-digit deflation and other methodological changes. FY23 real GDP has increased to Rs 261 lakh crore compared to Rs 161 lakh crore in old series. FY25 level increased to Rs 300 lakh crore from Rs 188 lakh crore in 2011-12 series.
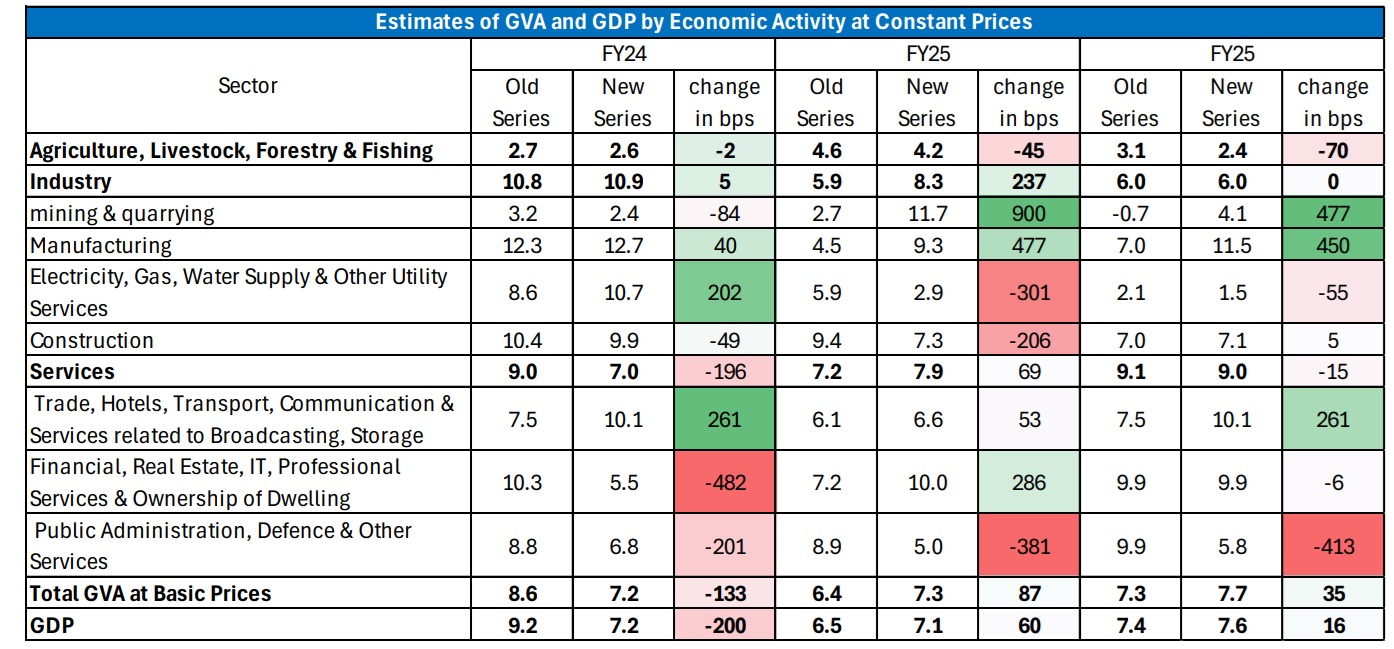
Manufacturing sector has been the major driver in contributing to the resilient performance of the economy in consecutive 3 financial years after rebasing. This sector has attained double digit growth rates in FY24 (12.7%) and FY26 (11.5%). In FY26, the quarterly manufacturing growth continue to be in double digits in all the quarters; Q1 10.6%, Q2 13.2% and Q3 13.3%. The completion methodology for 2023 base estimates is long. Two things deserves special attention. One of the limitations in old series was use of single deflation to arrive at real series. However, in the new series, effort has been made to use single extrapolation or, in some cases, double deflation.
Firstly, as input structure as well as price indices for input and output items for manufacturing sector are available, double deflation has been used in manufacturing industry. For remaining sectors where single deflation was being used, use of volume extrapolation has been explored. Volume extrapolation implicitly assumes that the input-output ratio (in volume terms) is constant in the short term, which is often a more reasonable assumption than single deflation's implicit assumption that the price of inputs moves in sync with the price of output. Wherever double deflation is not feasible due to data constraint, the Volume extrapolation and Single extrapolation is applied through reliable indicators.
Further disaggregated deflators will be used instead of single deflator in old series. For example, Unit Value Indices (UVI) at commodity-group level rather than the aggregate level are used for the constant price estimates of export and import of goods. Secondly, In line with the recommendations made in the Quarterly National Accounts (QNA) Manual (IMF, 2017), Proportional Benchmarking method has been evaluated and found to keep the ratio of the benchmarked series to the indicator (i.e., the quarterly BI ratio) as constant as possible, subject to the constraints provided by the benchmarks. This enables us to avoid the artificial discontinuities in the QNA series as well as preserve the movement of the indicators. There are some defining features from the GDP new series.
Firstly, India's Quarterly revisions show downward revisions in yoy growth for all quarters except Q1FY25, Q2FY25, Q3FY25 and Q2FY26, with steepest revision in case of Q1FY24 followed by Q3FY24. Sector wise growth shows decline in real growth in case of public administration, defence and other services (except for Q4 FY24).
Secondly, Reduction in Nominal GDP numbers along with higher savings and investment have led to higher savings rate and investment rate. FY24 savings rate increased to 32.8% from 30.7% in old series, while investment rate has increased to 34.5% from 31.4% in old series. Per capita GDP (nominal) decreased by Rs 8,000 during FY24-26 in new series, the decline in per capita PFCE is more prominent. With revised lower nominal GDP numbers, fiscal deficit for FY26 and FY27 now stand at 4.8% of GDP. FY23 FD has been revised upwards to 6.7% from 6.5%, FY24 to 5.9% from 5.5%, FY25 to 5.3% from 4.8%. Centre debt to GDP ratio will rise from 56.2% to 58.1% of GDP in FY26.
Thirdly and most importantly, the 2011-12 base series remained marred in its accuracy of measuring the true value of India’s GDP. One of the terms that was the center of all is the statistical discrepancy (SD). SD arises because the GDP from expenditure side and GVA are measured using two different methods. This requires reconciling the two estimates resulting in SD mostly added on expenditure side. The trends in the SD in real GDP over the entire history of the 2011-12 series show that SD remained positive, indicating that expenditure side was estimated lower than production side. The largest two errors were recorded in COVID-19 period. The new series allows us to understand the divergence much better.
Fourthly, using employment data from RBI KLEMS and juxtaposing these numbers with FY23 old/new manufacturing numbers at constant prices, we arrived at the conclusion that contribution of almost 2.5 crore manufacturing workers gets formalised in new series. Assuming a per capita wage rate of Rs15000 per month, delineates Rs 4.3 lakh cr formalization gain in the new series for manufacturing sector alone.
To cut a long story short, we believe, the new series is quite comprehensive and attempts an honest reconciliatory approach, enhancing a wide net that covers myriad data points, uncovering a better version of the India growth story that is led by animal spirits in manufacturing which augurs well for employment creation.