In Rupee We Trust
FinTech BizNews Service
Mumbai, December 17, 2025: The State Bank of India’s Economic Research Department has come out with a Research Report on the Rupee. The report has been authored by Dr. Soumya Kanti Ghosh, Group Chief Economic Advisor, State Bank of India.
The days of largesse flows largesse is over as geopolitical uncertainties have taken centerstage… Past trends suggest that during CY07-CY14 net portfolio inflows averaged $162.8 bn, while from CY15-CY25 (*till date) portfolio inflows have been much lower at $87.7 bn…The abundance of portfolio inflows prior to CY14 was the primary reason for rupee movements…Such a luxury is absent now as geopolitical uncertainties driven by the delay in trade deal has been the single most important reason…India’s trade data shows the remarkable resilience in navigating through prolonged uncertainty, more protectionism and labor supply shocks ▪ While the geopolitical risk index has moderated since Apr’25, the current average value of index for Apr-Oct’25 is much greater that its decadal average, which indicate how much pressure global uncertainties is exerting pressure on INR.
❑ Consistent with our empirical analysis, the rupee is currently in a depreciating regime…the Rupee is likely to exit Regime…Thereafter, we believe that the Rupee is likely to bounce back strongly in the second half of next fiscal
The Three phases of Rupee Depreciation.....We are in Phase III now...
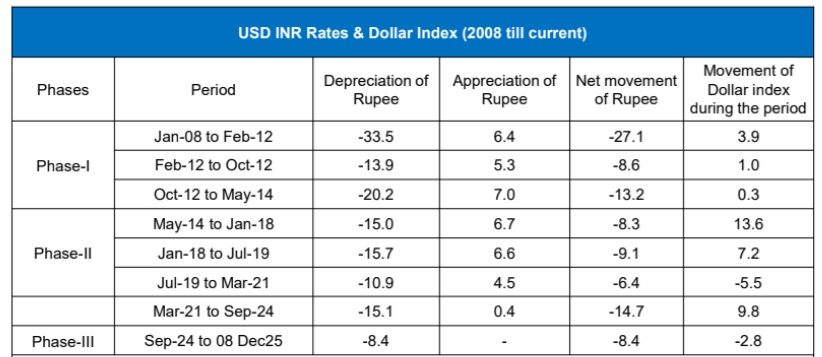
❑ Rupee movements have primarily gone through three phases
• Phase - I: Rupee Depreciation greater than Dollar Appreciation : During Jan-08 till May-14 Dollar appreciated by 1.7% on average while Rupee depreciated by 16.3% on average. This highlights a phase where domestic fundamentals were weak
• Phase – II: Rupee Depreciation equivalent to Dollar Appreciation : During May-14 till Mar-21 Rupee depreciated by 7.9% on average while dollar appreciation during the same period was almost equivalent at 5.1% delineating the synchronous movement of Rupee with Dollar index
• Phase- III: Both Rupee and Dollar Depreciation : Between Sep-24 till present, both Dollar and Rupee are depreciating...This concurrent depreciation marks a distinct phase characterized by heightened geopolitical uncertainty in the present global order
Rupee gains smarty after a day of rapid decline
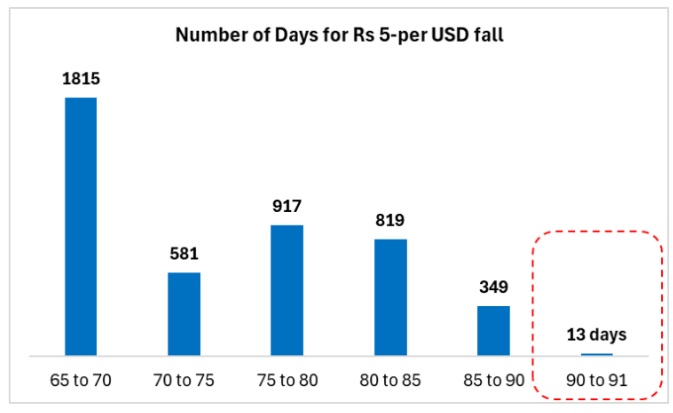
❑ After breached the psychologically important mark of 90 per US dollar, the rupee in just few days crossed the 91-level yesterday (16 Dec)....From 90 to 91 per dollar rupee took only 13 days!!..However, the rupee staged a sharp recovery the day after on Dec 17th...
❑ The data also indicates that the current fall is the quickest (in terms of number of days) of rupee, scaled to 5 per USD. In less than a year rupee has slid from 85 to 90 per dollar
Why the Rupee has been depreciating?
Unprecedented Geopolitical uncertainties is the prime driver of Rupee Depreciation...
❑ The Geopolitical Risk Index shows a steep rise in Apr-25 when US imposed a 50% tariff to India and has driven rupee depreciation....
❑ While the geopolitical risk index has moderated significantly since Apr’25, the current average value of index for Apr-Oct’25 is much greater that its decadal average, which indicate how much pressure global uncertainties is exerting pressure on INR
The current slide appears to be primarily driven by FPI outflows, chiefly equities (after two years of robust inflows) and uncertainty regarding US-India trade deal
❑ Past trends suggest that during CY07-CY14 net inflows averaged $162.8 bn, while from CY15-CY25 (*till date) FII inflows have been much lower at $87.7 bn...The largesse of portfolio inflows prior to CY14 was the primary reason for rupee movements.. As geopolitical uncertainties have taken centerstage
Since 02 Apr’25, when US announced sweeping tariff hikes across economies, Indian rupee (INR) has deprecated by 5.7% against USD (most amongst the major economies), notwithstanding sporadic phases of appreciation owing to optimism over US-India trade deal. While INR is the most depreciated currency, it is not the most volatile
❑ This clearly indicate that the 50% tariff imposed on India is one of the major factors behind current phase of rupee depreciation
Since July 2025 the spot excess demand in merchant category was continuously increasing but exhibited substantial fall in Nov’25. However, in the forward merchant market demand has increased significantly.
❑ Still, the combined excess demand in merchant market was thus $145 billion, which was unprecedented and sought timely intervention
RBI has been intervening sporadically to prevent volatility in markets...
❑ India’s forex reserve reached $703 bn in June 2025 but declined to $687.2 billion for the week ended 05 Dec’2025, which is primarily due to capital outflows and possibly intervention by RBI in the forex market to curb the volatility in the exchange rate. As per the latest available data, RBI has intervened around $18 billion in the forex market during June-Sept, and we have estimated (by looking at the forward market data) another $10 billion in Oct’25. So, the total amount stands at around ~$30 billion, while forex reserves declined by $15 billion during the same period
❑ By plotting the change in forex reserve with RBI’s intervention in the forex market during Jan’2023 to till now, it indicate a high positive correlation coefficient of 0.80
If we look at the movement of trade weighted REER (40 currencies/6 currencies) it remained range bound till Dec’24 even though USD INR has been depreciating. However, this year we can clearly see that REER has been declining (falling below 100) along with depreciating INR against USD. This in turn implies that rupee has been depreciating against other currencies
The Three phases of Rupee Depreciation…..We are in Phase III now…
❑ Rupee movements have primarily gone through three phases • Phase - I: Rupee Depreciation greater than Dollar Appreciation : During Jan-08 till May-14 Dollar appreciated by 1.7% on average while Rupee depreciated by 16.3% on average. This highlights a phase where domestic fundamentals were weak • Phase – II: Rupee Depreciation equivalent to Dollar Appreciation : During May-14 till Mar-21 Rupee depreciated by 7.9% on average while dollar appreciation during the same period was almost equivalent at 5.1% delineating the synchronous movement of Rupee with Dollar index • Phase- III: Both Rupee and Dollar Depreciation : Between Sep-24 till present, both Dollar and Rupee are depreciating…This concurrent depreciation marks a distinct phase characterized by heightened geopolitical uncertainty in the present global order