The average microfinance loan ticket size surged 17.5% Y-o-Y to Rs63,100; Overall risk management remains stable, supported by regulatory guardrails.

FinTech BizNews Service
Mumbai, 06 November, 2026: India’s microfinance sector continues to consolidate toward larger loan sizes with steady portfolio performance. Overall risk management remains stable, supported by regulatory guardrails, as per ‘CRIF MicroLend QUARTERLY MICROFINANCE LENDING INSIGHTS NOVEMBER 2026’.
PORTFOLIO TRENDS
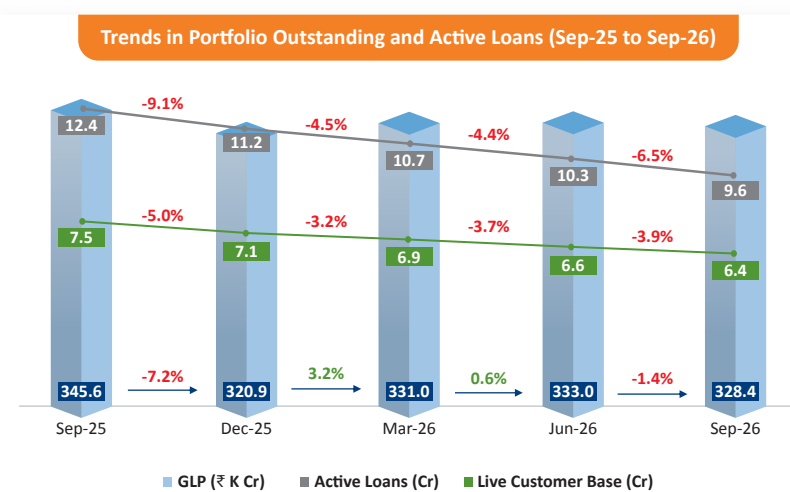
The microfinance portfolio stood at Rs328.4K crore in Sep’26, down 5.0% YoY and 1.4% QoQ, supported by 9.6 crore active loans serving 6.4 crore borrowers. The reduction stems from deliberate policy recalibration alongside moderated originations throughout the last quarter. Asset quality overall remained steady, although PAR 1-30 slightly inched up by 10 bps between Jun ’26 and Sep ’26. Both PAR 31-90 and PAR 91-180 remained stable at 0.8%.
KEY POSITIVE DRIVERS
As per the Data as of Sept'26, Tamil Nadu stood out with a 3.7% QoQ increase in portfolio outstanding, coupled with an improvement in PAR 31–180. Overall average MFI ticket size rose further to Rs63K in Q2 FY27, up 1.6% QoQ and 17.5% YoY, reflecting disbursement of higher ticket-size loans supported by stronger borrower profiles.
LENDER DYNAMICS
NBFC-MFIs strengthened their lead, disbursing nearly 50% of loans in Q2 FY27, up from 47.7% in Q2 FY26 (YoY). NBFCs and SFBs maintained a steady share of 14% in Q2 FY27 in originations value.
TICKET SIZE DYNAMICS
Loans in the Rs50K–Rs80K segment remained steady at 41% of origination value. Meanwhile, the share of Rs80K–Rs1L and Rs1L+ loans expanded from 14.7% to 18.5% and from 11.2% to 15.1%, respectively, YoY. PERFORMANCE
Overall microfinance loan delinquency remained stable as of Sep ’26, with all buckets (PAR 1–30, 31–90, 91–180) contained below 1% despite moderation in portfolio size. Banks, however, showed a slight increase in PAR 31–90 from 0.8% to 1% between Jun ’26 and Sep ’26. Driven by regulatory guardrails, borrowers with ≤2 active lenders constituted the majority of the portfolio (81.2%) and demonstrated improved performance (1.9% PAR 31-180 as of Sep’26 compared to 4.1% for 3 lender associations and 6.6% for >3 lender associations).
