Electronic Goods Exports Up By 39% To US$ 3.69 Bn
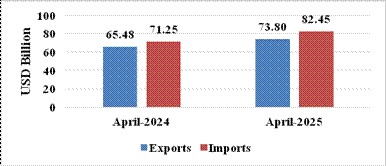
Total Exports (merchandise & services) during April 2025 are estimated at US$ 73.80 Billion, as compared to US$ 65.48 Billion during April 2024, an estimated growth of 12.70%.
FinTech BizNews Service
Mumbai, May 15, 2025: India’s total exports (Merchandise and Services combined) for April 2025* is estimated at US$ 73.80 Billion, registering a positive growth of 12.70 percent vis-à-vis April 2024. Total imports (Merchandise and Services combined) for April 2025* is estimated at US$ 82.45 Billion, registering a positive growth of 15.72 percent vis-à-vis April 2024.
Table 1: Trade during April 2025*
| | April 2025 (US$ Billion) | April 2024 (US$ Billion) |
Merchandise | Exports | 38.49 | 35.30 |
Imports | 64.91 | 54.49 |
Services* | Exports | 35.31 | 30.18 |
Imports | 17.54 | 16.76 |
Total Trade (Merchandise +Services) * | Exports | 73.80 | 65.48 |
Imports | 82.45 | 71.25 |
Trade Balance | -8.65 | -5.77 |
* Note: The latest data for services sector released by RBI is for March 2025. The data for April 2025 is an estimation, which will be revised based on RBI’s subsequent release.
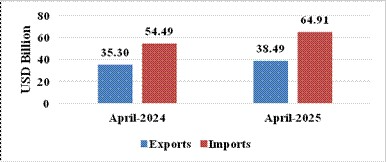
MERCHANDISE TRADE
- Merchandise exports during April 2025 were US$ 38.49 Billion as compared to US$ 35.30 Billion in April 2024.
- Merchandise imports during April 2025 were US$ 64.91 Billion as compared to US$ 54.49 Billion in April 2024.
Fig 2: Merchandise Trade during April 2025
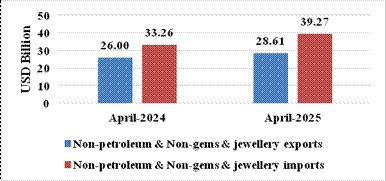
- Non-petroleum and non-gems & jewellery exports in April 2025 were US$ 28.61 Billion compared to US$ 26 Billion in April 2024.
- Non-petroleum, non-gems & jewellery (gold, silver & precious metals) imports in April 2025 were US$ 39.27 Billion compared to US$ 33.26 Billion in April 2024.
Table 2: Trade excluding Petroleum and Gems & Jewellery during April 2025
| April 2025(US$ Billion) | April 2024 (US$ Billion) |
Non- petroleum exports | 31.11 | 28.26 |
Non- petroleum imports | 44.20 | 37.99 |
Non-petroleum & Non-Gems & Jewellery exports | 28.61 | 26.00 |
Non-petroleum & Non-Gems & Jewellery imports | 39.27 | 33.26 |
Note: Gems & Jewellery Imports include Gold, Silver & Pearls, precious & Semi-precious stones
Fig 3: Trade excluding Petroleum and Gems & Jewellery during April 2025
SERVICES TRADE
- The estimated value of services export for April 2025* is US$ 35.31 Billion as compared to US$ 30.18 Billion in April 2024.
- The estimated value of services imports for April 2025* is US$ 17.54 Billion as compared to US$ 16.76 Billion in April 2024.
Fig 4: Services Trade during April 2025*
- Exports of Tobacco (66.43%), Coffee (47.85%), Electronic Goods (39.51%), Mica, Coal & Other Ores, Minerals Including Processed Minerals (34.43%), Fruits & Vegetables (30.72%), Marine Products (17.81%), Tea (15.93%), Meat, Dairy & Poultry Products (15.85%), Rmg Of All Textiles (14.43%), Rice (13.63%), Engineering Goods (11.28%), Gems & Jewellery (10.74%), Spices (8.38%), Cereal Preparations & Miscellaneous Processed Items (7.71%), Petroleum Products (4.68%), Jute Mfg. Including Floor Covering (4.58%), Plastic & Linoleum (4.58%), Man-Made Yarn/Fabs./Made-Ups Etc. (4.18%), Leather & Leather Products (3.91%), Carpet (3.32%), Drugs & Pharmaceuticals (2.37%), Cotton Yarn/Fabs./Made-Ups, Handloom Products Etc. (1.71%) and Ceramic Products & Glassware (0.23%) record positive growth during April 2025 over the corresponding month of last year.
- Imports of Pulses (-23.5%), Newsprint (-14.4%), Coal, Coke & Briquettes, Etc. (-12.28%), Fruits & Vegetables (-8.97%), Vegetable Oil (-8.09%), Leather & Leather Products (-4.84%) and Transport Equipment (-3.18%) record negative growth during April 2025 over the corresponding month of last year.
- Services exports is estimated to grow by 17.01 percent during April 2025* over April 2024.
- Top 5 export destinations, in terms of change in value, exhibiting positive growth in April 2025 vis a vis April 2024 are U S A (27.31%), U Arab Emts (33.65%), Australia (74.16%), Tanzania Rep (87.2%) and Kenya (132.44%).
- Top 5 import sources, in terms of change in value, exhibiting growth in April 2025 vis a vis April 2024 are U Arab Emts (88.97%), China P Rp (27.08%), U S A (63.76%), Russia (17.82%) and Ireland (425.65%).