TRADE MOMENTUM REMAINS FIRM DESPITE HICCUPS
FinTech BizNews Service
Mumbai, November 22, 2025: The rupee, valiantly defending its levels for weeks, and having appreciation bias in early hours went for a tailspin towards the fag end on Friday, breaching 89.49. The sudden spike could be a culmination of a mix of factors; the melt down in global markets and Asia as super rich AI valuations concentrated around mag7 are being questioned, digital assets are tumbling and Sell Japan is gaining momentum, argues the State Bank of India’s Economic Research Department’s special Research Report. The report has been authored by Dr. Soumya Kanti Ghosh, Group Chief Economic Advisor, State Bank of India:
The idea, Trade is like Water, propagated by ex-MAS chief Ravi Menon, as also Singapore's Prime Minister, Lawrence Wong, interweaving the power of export diversification and thus finding alternatives to imports seems to be playing out as Indian exports are concerned.
Declining Share Of USA In India’s Exports
India’s total merchandise exports during FY26, Apr-Sep’25 inched up by 2.9% to $220 bn ($214 bn in H1 FY25). Cumulative exports to the USA also registered growth of 13% to $45 bn in FY26 Apr-Sep from $40bn in FY25 Apr-Sep though there could be some front loading effects to the aftermaths with September figures registering negative yoy growth of 12%. Furthermore, if we look at the share of USA in our exports, it has been declining since July 2025, moving down to 15% in Sep’25, with marine products (15% in Sep’25 from 20% in FY25), precious, semi-precious stones (6% in Sep from 37% in FY25), RMG cotton (29% in Sep from 34% in FY25) and cotton fabrics, made up articles exports (31% in Sep’25 from 39% in FY25) leading the pack even though Marine products and RMG cotton witnessed positive growth during Apr-Sep’25.
India’s merchandise exports to other countries
Interestingly, share of India’s merchandise exports to other countries during this period has increased significantly indicating the diversification of our exports basket with UAE, China, Vietnam, Japan and Hong Kong, as also Bangladesh, Sri Lanka and Nigeria being among the top destinations (over FY25) across different product categories. So, could it be that some destinations are now exporting more to the USA after procuring from India? Australia’s share in USA imports of pearls, precious, semi-precious stones has increased to 9% YTD in Jan-Aug 2025 from 2% during the same period in the previous year. Like that Hong Kong too registered increase in share from 1% to 2% to USA during the same period. Meanwhile, when we look at the imports of these commodities by the USA, August shows declining growth.
Enhancing Global Competitiveness Of Indian Exporters
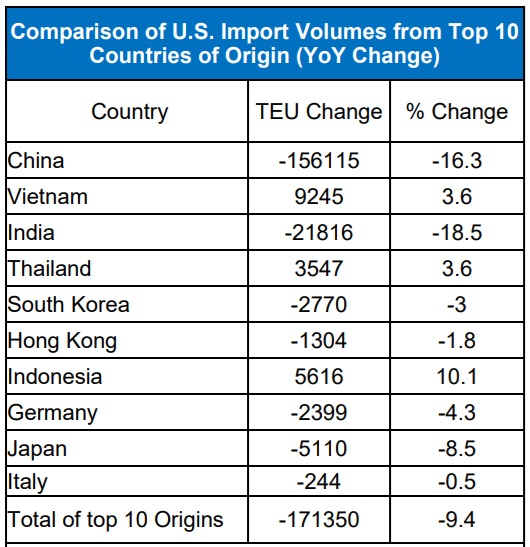
The buoyancy in trade talks reaffirms India’s desire to come out of the highest (among Asian peers) tariff structure while enhancing capability building across several loops with recently concluded LPG deals and strategic defence deals last month bolstering the fair probability of a mutually amicable, fruitful negotiation. Tariff has impacted India’s labour-intensive sectors such as textiles, jewellery and seafood, particularly shrimp – which operates with a lower margin. To support the exporters, Government has approved Rs 45,060 crore, including Rs 20,000 crore in credit guarantees on bank loans. This is aimed to enhance the global competitiveness of Indian exporters and support diversification into new and emerging markets. By enabling collateral-free credit access under CGTMSE, it will be strengthening liquidity, as also ensures smooth business operations since the tariffs have led to a steep drop in container volume of shipments to US.
Digital Assets Tumbling
Meanwhile, rupee, valiantly defending its levels for weeks, and having appreciation bias in early hours went for a tailspin towards the fag end on Friday, breaching 89.49. The sudden spike could be a culmination of a mix of factors; the melt down in global markets and Asia as super rich AI valuations concentrated around mag7 are being questioned, digital assets are tumbling and Sell Japan is gaining momentum, with the DXY scaling post 100. With RBI making its stance clear that it is not there to defend any level for the local currency, and its rich valuations on REER/NEER matrix, the momentum in offshore NDF could have led to the spike that does not have any structural implications for the strength of the currency.
Improvement in CAD
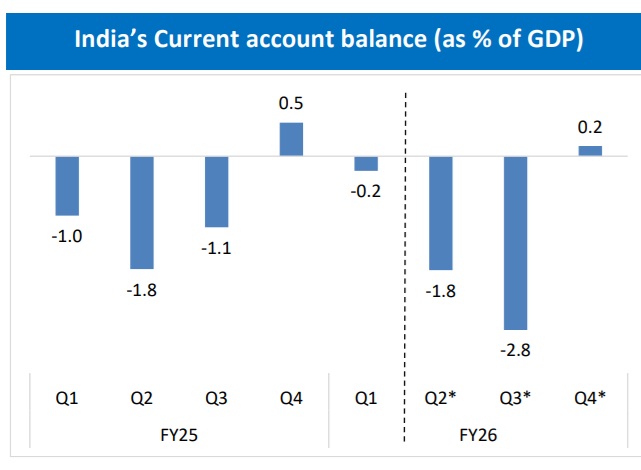
On a BoP basis, India’s current account deficit (CAD) placed at 0.2% of GDP in Q1 FY26, as against 0.9% in Q1 FY25. This improvement in CAD was mainly owing to robust services exports and strong inflow of remittances. Based on the above trends, we expect India’s current account will be in deficit mode of 1.8%/2.8% of GDP in Q2/Q3 FY26 before it will turn into positive side in Q4 FY26. For the complete fiscal (FY26), we expect an overall deficit in the range of ~1.0-1.3% of GDP. Regarding overall BoP, we expect a marginal deficit of upto $10 billion for FY26 as compared to $5.0 billion in FY25. Thus, even though BOP will turn negative in FY26, the alarm bells that are being sounded regarding its impact on rupee movements seems to be a little overblown at this point. In fact, at an aggregate basis, India’s merchandise trade balance of goods and services has increased very modestly during Apr-Oct, even after the tariff meltdown.