The policy dilemma for markets is therefore increasingly a “chalk or cheese” problem: should investors read the hawkish undertone of the minutes as a signal that an October rate hike remains on the table, or follow the Governor’s more cautious wait-and watch communication?
FinTech BizNews Service
Mumbai, 23 August, 2026: The latest SBI Ecowrap from the State Bank of India’s Economic Research Department focuses on MONETARY POLICY. The report has been authored by Dr. Soumya Kanti Ghosh, Group Chief Economic Adviser, State Bank of India:
THE CHALK AND CHEESE IN MONETARY POLICY
636 years back, in 1390, the expression “chalk and cheese” was first used by the poet John Gower in English literature. In principle, pieces of white chalk and pieces of white cheese can look erringly similar from a distance but they are two completely different things.
Interestingly, the recent monetary policy minutes, monetary policy press statement and Governor statement for August and even earlier months reveal this conundrum of “chalk and cheese” in monetary policy. There were clear and divergent signals from these 3 statements despite originating from the same institution/source. This is precisely the communication puzzle emerging from the RBI’s latest policy cycle: the latest MPC minutes appear more hawkish, keeping inflation risks and the possibility of further tightening in focus while the Governor’s statement sound considerably more patient and datadependent.
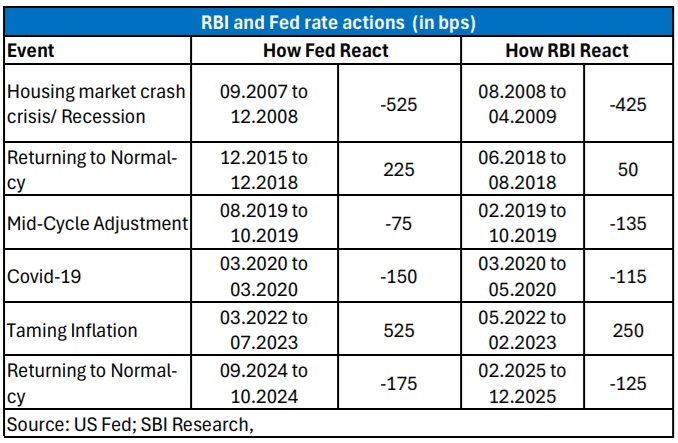
This distinction matters because forward guidance shapes market expectations almost as much as the policy decision itself. To examine this divergence, we applied NLPbased tone analysis to matched MPC minutes, policy statements and Governor statements from June 2025, which we believe were the starting point for this divergence, when the 50 basis point rate cut was accompanied by a stance change to neutral.
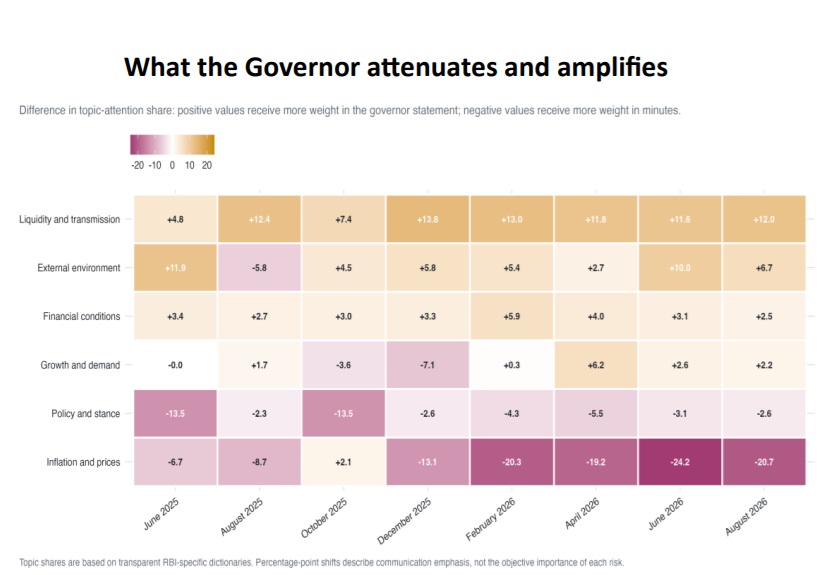
To examine this divergence we analysed the divergence of common themes between the Governor statement, Monetary Policy Statement (incidentally, the shortest one) and MPC minutes place and compare their difference. In fact, the divergence is particularly pronounced in “policy and rates” and “inflation and prices”, suggesting that the minutes attach greater weight to the risks most relevant for the future rate trajectory, whereas the Governor’s communication tends to attenuate these concerns and give relatively greater weight to growth and financial conditions. As a matter of fact, in terms of macro tones if the Governor statement is indexed to 1, the MPC minutes statement is at 1.76 in June 2026 and rises further to 1.82 in August 2026.
In effect, when we look at the matched differences in macro documents between Governor statement, MPC meeting minutes and Monetary Policy Statement in terms of macro tones, we find that the Governor’s statement is most dovish in the corpus followed by MPC minutes and the Monetary Policy Statement has the most hawkish tone. We believe this wedge may be attributed to deliberate risk softening in the Governor’s consensus narrative. Positive Values are hawkish and negative values are dovish What the Governor attenuates and amplifies
The policy dilemma for markets is therefore increasingly a “chalk or cheese” problem: should investors read the hawkish undertone of the minutes as a signal that an October rate hike remains on the table, or follow the Governor’s more cautious wait-and watch communication? Let us now examine the rationale of any such possibilities.
WILL THE EXTERNAL ECONOMY SUPPORT A RATE HIKE SOONER THAN LATER? FIRSTLY, GLOBAL CONDITIONS IS LIKELY TO TURN WORSE WITH US GROWTH COMING OFF...
U.S. economy showing resilient growth driven by consumer spending and artificial intelligence investment, but faces notable downside risks. These risks include cooling non-farm payrolls—marked by a surprise contraction in July—and an unsustainable national debt trajectory leading to elevated longterm borrowing costs
US DEBT CROSSED $ 40 TRILLION!
The US national debt has crossed $40 trillion, after crossing $39 trillion only in March. The debt has also more than doubled from about $20 trillion in 2017, while annual interest payments are approaching $1.2 trillion and the average interest rate on the debt is above 3.5%. This creates a growing fiscal pressure: large deficits require more Treasury borrowing, which increases the supply of bonds and can push long-term yields higher; higher yields, in turn, make servicing the debt even more expensive.
Against this backdrop, the Treasury has doubled its buyback of longer-dated securities from $2 billion to $4 billion per operation from September 9, aiming to support bond prices and ease pressure on long-term yields. This recent bond market intervention by US Treasury is in part due to weakness in yen which has created a selling pressure in US treasury from Bank of Japan for intervention in domestic FX market.
With Jackson Hole scheduled for August 27–29, markets will now look for signals on the Fed’s rate path, particularly as higher oil prices and geopolitical risks could keep inflation concerns elevated. However, it looks unlikely that the Fed is going to hike soon in September as a bond buy back program and a rate hike are mutually incongruous.
India itself presents a “chalk-and-cheese” picture i.e. the latest MPC minutes retain a hawkish undertone, with concerns about inflation and even the possibility of future tightening, while Governor Malhotra’s press conference and statement struck a more dovish, data-dependent and wait-and-watch tone.
THE BUY BACK PROGRAM OF US TREASURY: WILL IT FINALLY RESULT IN A REAL QE?
With Intragovernmental Holdings of $7.73 trillion O/S, total government debt stood at $39.8 Tn on July end, crawling above $40 Tn this week as government borrowing has been close to $2 Tn this year.
Basis Aug 19 communique, the Treasury is increasing, by at least double, the size of liquidity support buyback operations for longer-dated nominal coupon securities (the 10-year to 20-year sector and the 20-year to 30-year sector). The current maximum size of $2 billion per operation will be at least $4 billion per operation.
However, this swapping long term debt for short term will apparently serves little purpose, other than a temporary reprieve on longer end of the curve, with total debt and dollars changing a little.
There is a dotted connect of the current Treasury intervention in Securities markets that is plotted around Mid Term elections. Interestingly, the liquidity support buyback operations is scheduled, as of now, till Nov. 4, the date of US mid term elections. (source: USvotefoundation.org)
What has taken the markets by surprise was the liquidity support announcement coming from Treasury Secretary, Scott Bessent, that select sections of markets could not help but interpret as jawboning, hints of a friction brewing between the White House and the Fed under Warsh that remains struck between ‘To Do or Not to Do’ see-saw on rate front, no forward guidance muddling the murky waters.
This action is more symbolic as of now (a la Operation Twist), but with a clear warning embedded to bond markets, where real yields have soared much higher, way past implied risk and term premium, of more creative interventions going forward. With no cap on intervention there is a good probability of Fed coming on stage with a real QE which complicates the plot essentially, in sync with YCC (Yield Curve Control) to keep long-term yields in check, that goes against the core philosophy of Warsh, keeping the Fed balance sheet in check. This is because the Treasury can’t do this themselves forever because the Treasury doesn’t print money. Meanwhile, even the IG (Investment Grade) and HY (High Yields) corporate yields have gone up, the later by 70-75 basis points since last October.
Large treasury holders, the usual suspects, are paying heed as they draw comfort from the presence of the state should there be a need to redeem without breaking the Bank in terms of value. That reminds us of two events; how the SDL market in India witnessed the similar phenomenon where a lot of SDL ownership, through passive accumulation, was on longer end of the curve, and the infamous Mississippi Bubble by John Law some 300 years, a tale of mania and follies that eventually took a toll on the French financial system.
There are all sort of hypotheses flying off the shelves; revaluation of the US balance sheet to Dollar bear thesis and capital outflows from EMs even as West Asia smolders. As these divergent forces collide and produce unanticipated results, a likely question should be more inward looking; what the Central Bank thinks of the theatre of these actions and actors through its kaleidoscopic view and if it should go the extra mile on rate front that lowers the cost of any follow-up action. Time may not be the greatest leveler this time, it seems
SECONDLY, MONSOON 2026 MAY BE FINALLY LOOKING WORSE… AND HENCE A RATE ACTION MAY LOOK INCONSISTENT
The progress of monsoon so far is erratic and highly uneven. While the nationwide shortfall is 13% only, the spatial distribution is extremely uneven. Major foodgrains producing states like Bihar(-41%), Andhra Pradesh (-39%), Punjab (-32%) & Karnataka (- 22%) are in huge deficit. Out of total 741 districts, 351 districts still received deficit/large deficit rains so far.
Skymet has recently revised its monsoon 2026 forecast, downgrading it to 85% of LPA (earlier: 94%), with a 70% probability of drought, amid escalating concerns over El Nino-associated with irregular weather patterns. As per Australian Bureau of Meteorology, El Niño is firmly established. Both oceanic and atmospheric indices now reflect values consistent with a strong El Niño, with further intensification likely during spring. The Indian Ocean Dipole (IOD) is currently neutral (not positive!). As of 16 August 2026, the weekly IOD index is +0.18 °C (lowest in 5 weeks).
The onset of El Nino may not impact Kharif production (as sowing progress so far is quite satisfactory) but will definitely have adverse impact on Rabi crops.
CPI INFLATION TRAJECTORY
Inflation print for July came in line with market expectations at 4.45%, Imported inflation declined from 8.1% in June 2026 to 7.3% in July 2026. We expect August inflation print at 4.7%, with inflation possibly just breaching the 6% in October and November before declining to ~5% in Q4 of FY27.
Keeping with the historical trends, inflation for Q4 is likely to be lower than forecasts.
FINALLY, IT IS IMPORTANT TO ADDRESS MONSOON RISKS NOW THROUGH VB-G RAM G THAN FOR A POLICY TIGHTENING
The VB-G RAM G came into force nationwide on 1 July 2026, replacing MGNREGA and raising the statutory annual employment guarantee from 100 to 125 days per eligible rural household.
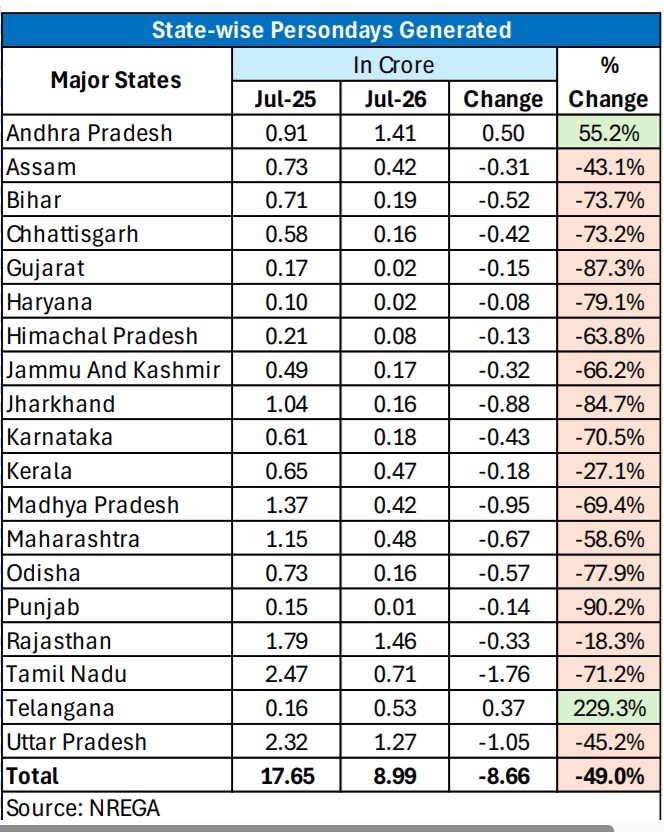
The July and August 2026 data indicate a 60% decline in person days generated. Out of the 19-major states, only 2 States AP & Telangana shows increase in person days. Though, it is very early to comment on the performance of the new scheme, however, the following points may be considered before comparison.
Agricultural pause: The new Act empowers states to notify an aggregate pause of up to 60 days during peak sowing and harvesting seasons, which was not during MGNREGA. By early August, Bihar, Gujarat, Odisha, Arunachal Pradesh, Mizoram, Sikkim and Nagaland had reportedly exercised the provision. The pause therefore produces a direct downward shift in measured person-days, even if the underlying need for income support is unchanged.
First-month transition and uneven administrative readiness: The transition required migration of ongoing works, issue or validation of new cards, software deployment, work identification, muster-roll creation, payment processing and alignment with Viksit Gram Panchayat Plans. This supports the view that data may contain reporting lags, as July data still changing now.
Going forward, in the next few months, particularly the post-pause rebound across states, will determine whether this July/August was mainly a transition shock or the first sign of a structurally lower reach of the rural employment guarantee. Let’s wait till December 2026!
